Real-Time Levels/Zones/Liquidity/Trendlines
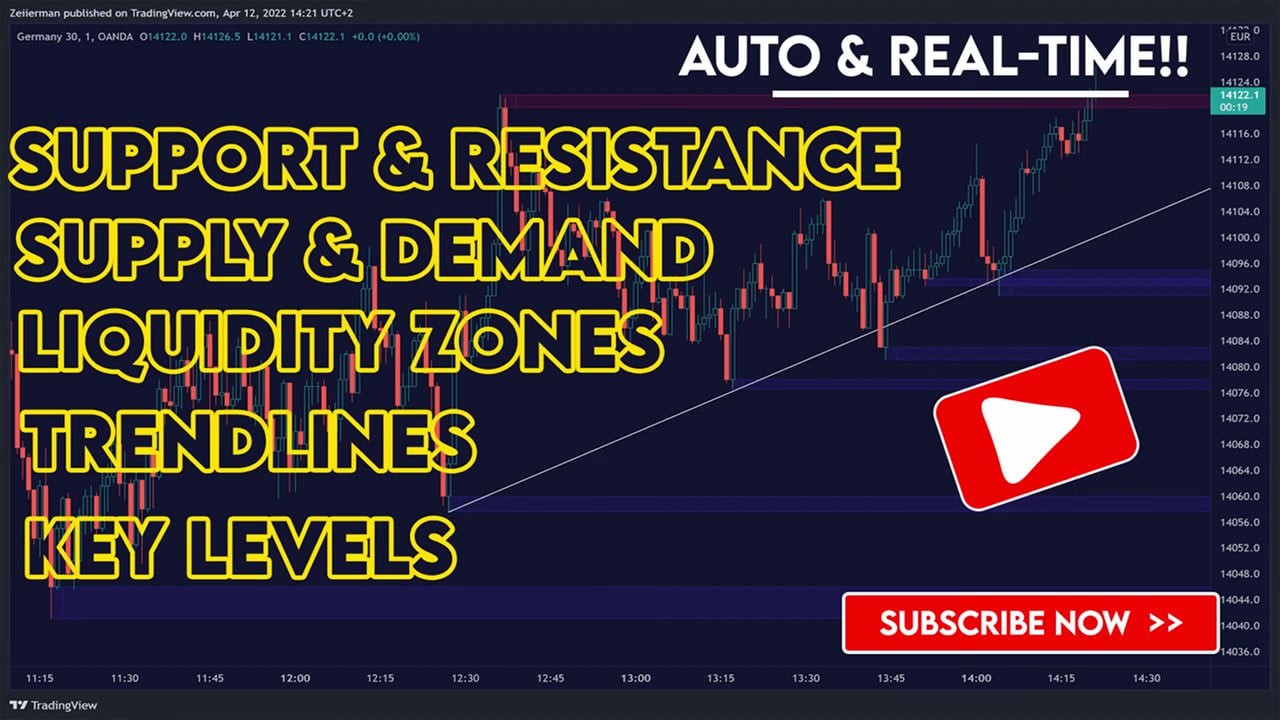
This trading tool automatically identifies real-time Support/Resistance, Supply/Demand, Liquidity Zones, Key levels, and Trendlines.
FEATURES
This indicator includes all necessary features for traditional technical analysis, such as Trendlines, Support/Resistance, Supply/Demand, and Liquidity Zones. In addition to that, we have added key market levels.
- TrendLines: Trendlines help traders determine the current direction of market prices. A trendline is displayed when a price action trend is detected.
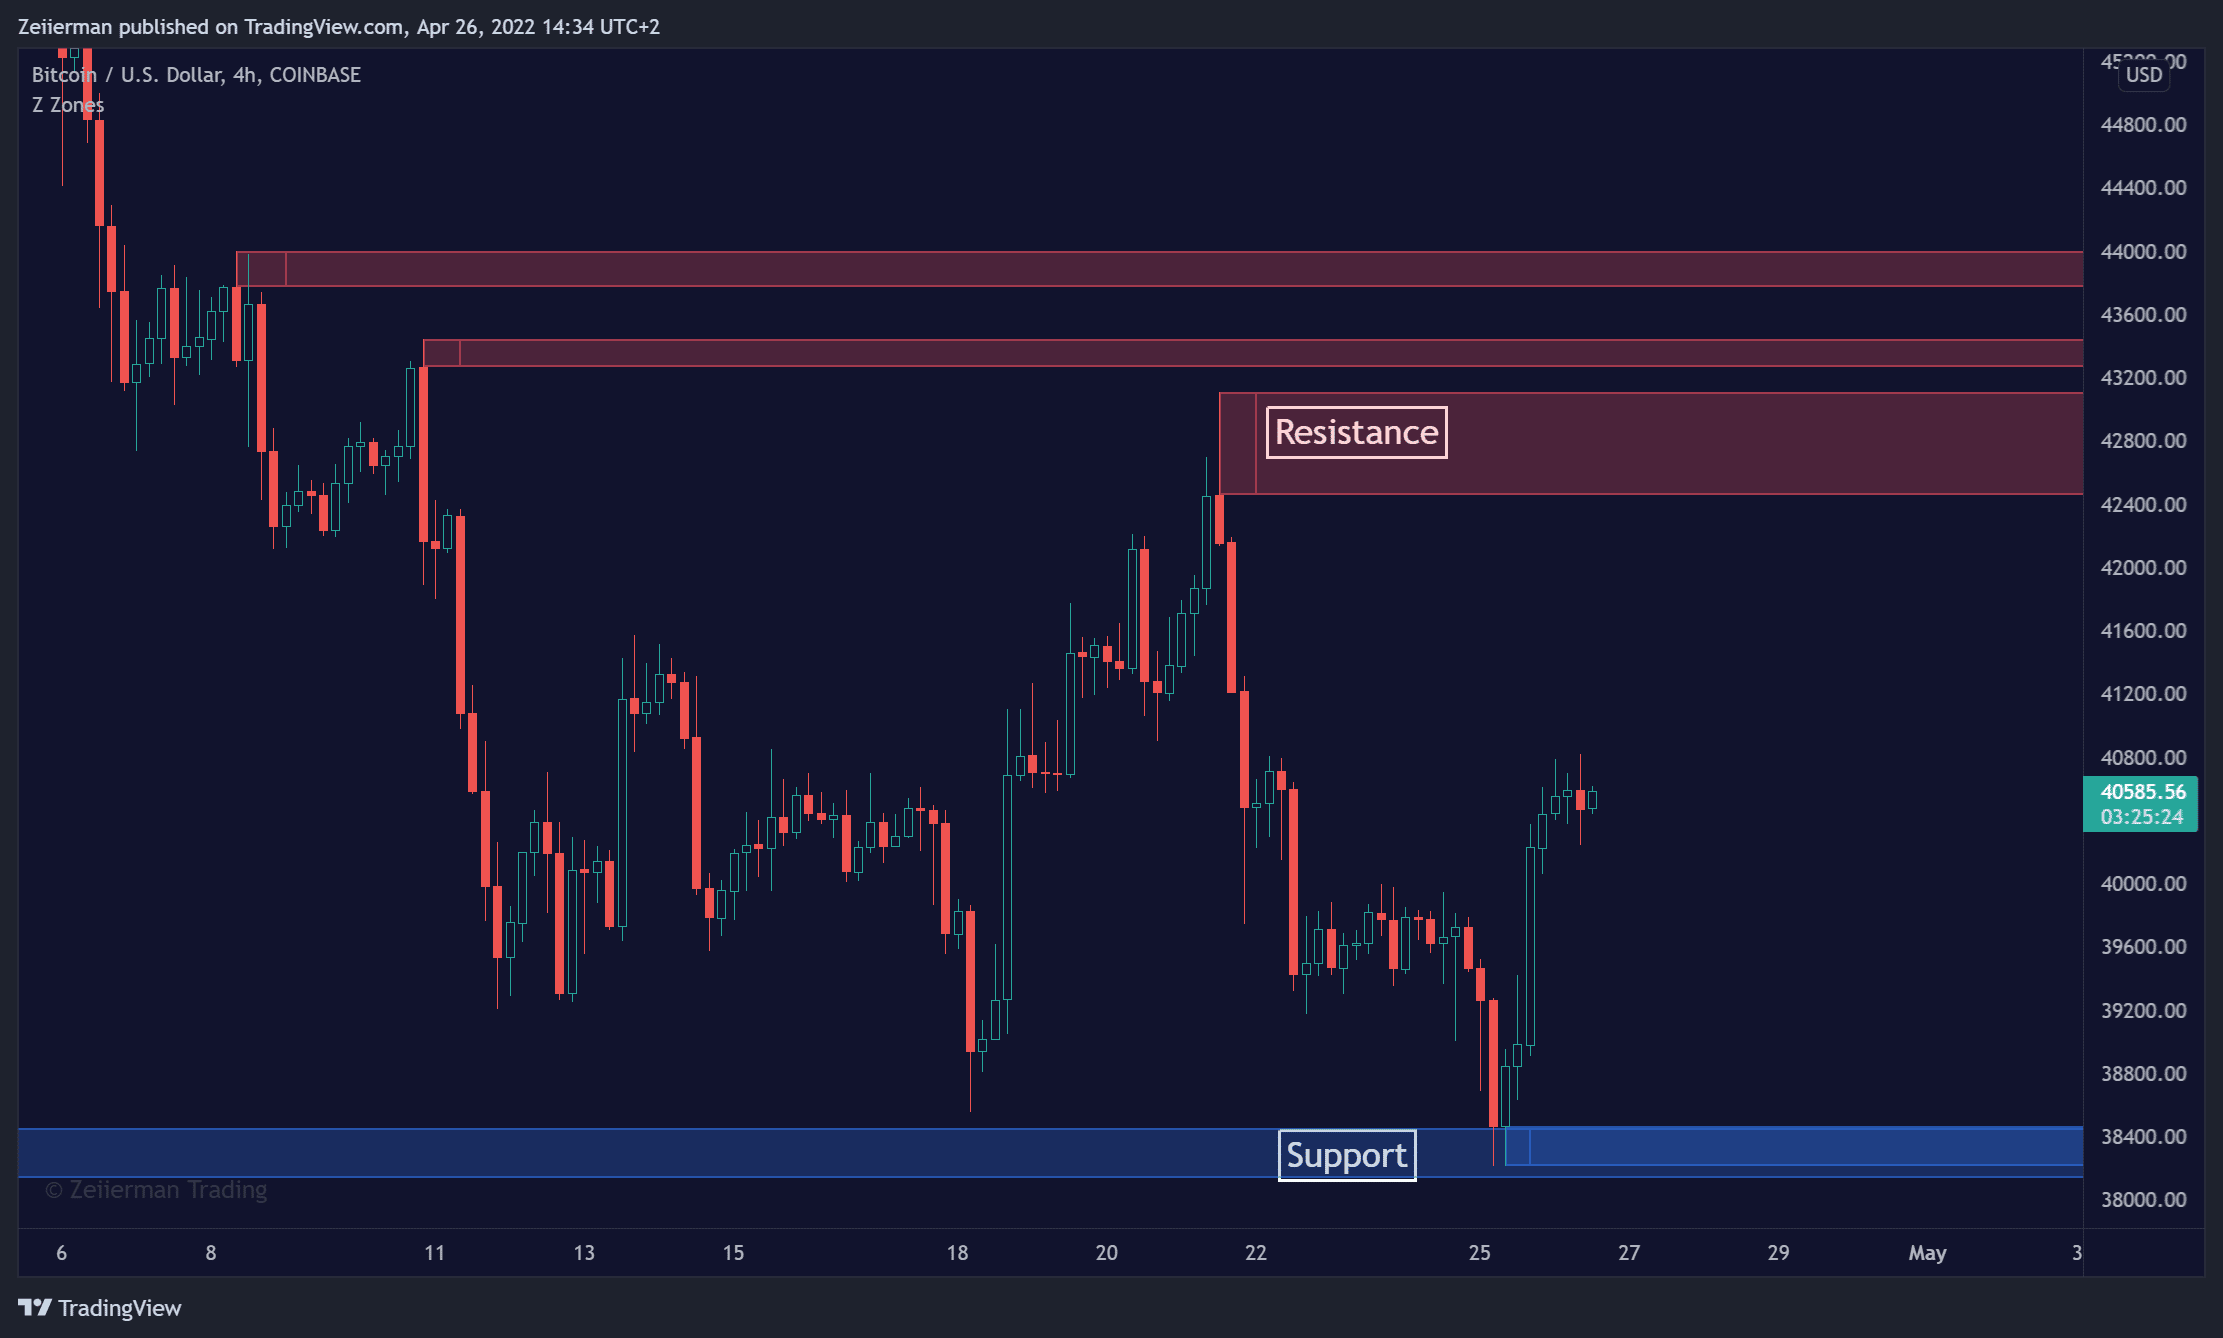
- Support/Resistance: Identifies areas in real-time where the price finds support and resistance.
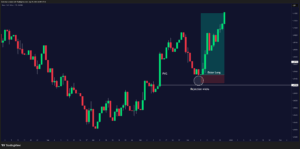
- Supply/Demand: The indicator analyzes the market structure in real-time and maps out key supply and demand zones. The user gets an instant understanding of the current market structure.
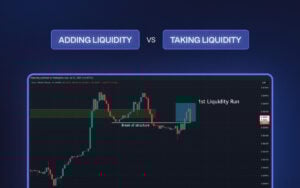
- Liquidity Zones: Liquidity zones are displayed where there is a significant level of trading activity and when there is both high supply and demand for an asset, security, or contract.
- Key Levels: Key levels are psychological levels that are under the attention of many traders. There is a lot of buying or selling pressure at these levels. At these key levels, price decides its direction, either to go bearish or bullish.
HOW TO USE
Use the indicator to identify several important and commonly used levels and zones. All zones work as a future reference where the price has a higher likelihood to react at, bounce off from, or reverse.
Zeiierman
With over 16 years in the market, Zeiierman has extensive experience as a full-time trader and risk advisory consultant for hedge funds. He has developed many profitable trading strategies, drawing on his background in risk management and strategy execution.
More from Zeiierman