Momentum trading is a short-term strategy, and its idea is pretty self-explanatory. Buy assets that show a strong uptrend (or sell those with downward price movement) and sell them once the trend slows or settles down – basically, betting that the current price direction will continue.
In short, momentum trading is a strategy that buys strength and sells weakness. Of course, it’s not a foolproof solution. Everybody would be rich if timing the market were that easy. That said, it’s also undeniable that momentum trading has survived decades of market evolution, algorithmic trading, and institutional dominance. Why? Because you’re not riding a wave without thought; there’s method to this madness, and I will teach you exactly that.
We’ll walk through momentum trading as it’s practiced in the real world: how momentum forms, how to recognize it, how traders enter and exit, and why most people fail even with a good strategy.
1. How does Momentum Trading work? (& Why)
Trading momentum is different from contrarian or value investing, where the idea is to buy up undervalued assets in hopes they’ll eventually bounce back or go higher.
Momentum arises from how markets are structured and how participants behave under pressure. If markets were perfectly efficient, momentum wouldn’t work. In a perfectly efficient market, every new piece of information will instantly reflect in prices, and past movements wouldn’t have any bearing on future price action.
Alas, that’s not the world we live in. There are three main reasons that, together, make momentum trading work as well as it does.
Read: Fair Value Gaps (FVGs): The Hidden Zones Institutions Leave BehindA. Institutional Capital Drives Sustained Moves
Banks, hedge funds, pension funds, and asset managers operate with capital sizes that make it impossible for them to enter or exit positions instantly. These big players gradually build a position, often over days or weeks, which naturally creates sustained directional price pressure on the asset price.
As these large orders are being executed, the price begins to move, and that movement often attracts additional participants who recognize the strength. This process then reinforces itself, creating momentum that extends well beyond the initial decision point.
📌 Tip: Momentum traders are not trying to guess what institutions will do next. Instead, they are observing the effects of institutional activity as it appears on the chart.
B. Human Psychology Reinforces Momentum
When prices start to surge in one direction, those who jumped in early feel more confident, while those who come in later get caught up in the fear of missing out. Meanwhile, traders who bet against the trend start to feel the heat and may want to sell, which pushes prices even further in the main direction.
This emotional cycle is a powerful force, and momentum traders know it doesn’t fade away just because prices seem to have gone too far. Strong momentum can feel pretty unsettling, given all those emotions are at play.
C. Algorithms Amplify Strengths and Weaknesses
Algorithmic trading systems heavily influence modern markets. Many of these systems are designed to ride the wave of momentum rather than go against it. They usually increase their investments when things are going well, pull back when the market calms down, and get out when the momentum starts to fade.
Because of this, when momentum kicks in, it often gets boosted even more by automated trading that operates way faster and at much larger scales than individual traders can keep up with.
That’s part of why momentum can seem so intense and sudden, especially during major breakouts or when news hits.
2. Momentum Trading Setup
A good momentum trade strategy rests on alignment between trend direction, momentum strength, and market participation. Momentum trades are far more structured and predictably repeatable when all of these elements work together. The strategy focuses on entering after the market has confirmed strength and staying involved only as long as that strength remains intact.
Here’s a quick ‘cheatsheet checklist’ for you to copy to replicate my momentum trading strategy:
- HTF trend aligned
- Momentum impulse + shallow pullback/squeeze
- Rising relative volume on expansion
- Entry: pullback to structure or squeeze break with follow-through
- Invalidation: last HL/LH or squeeze failure
- Targets: prior liquidity/imbalances; trail with ATR/structure
Don’t worry about understanding what it means just yet. You’ll know everything once we go through the strategy steps below.
Step 1: Define the Market Environment
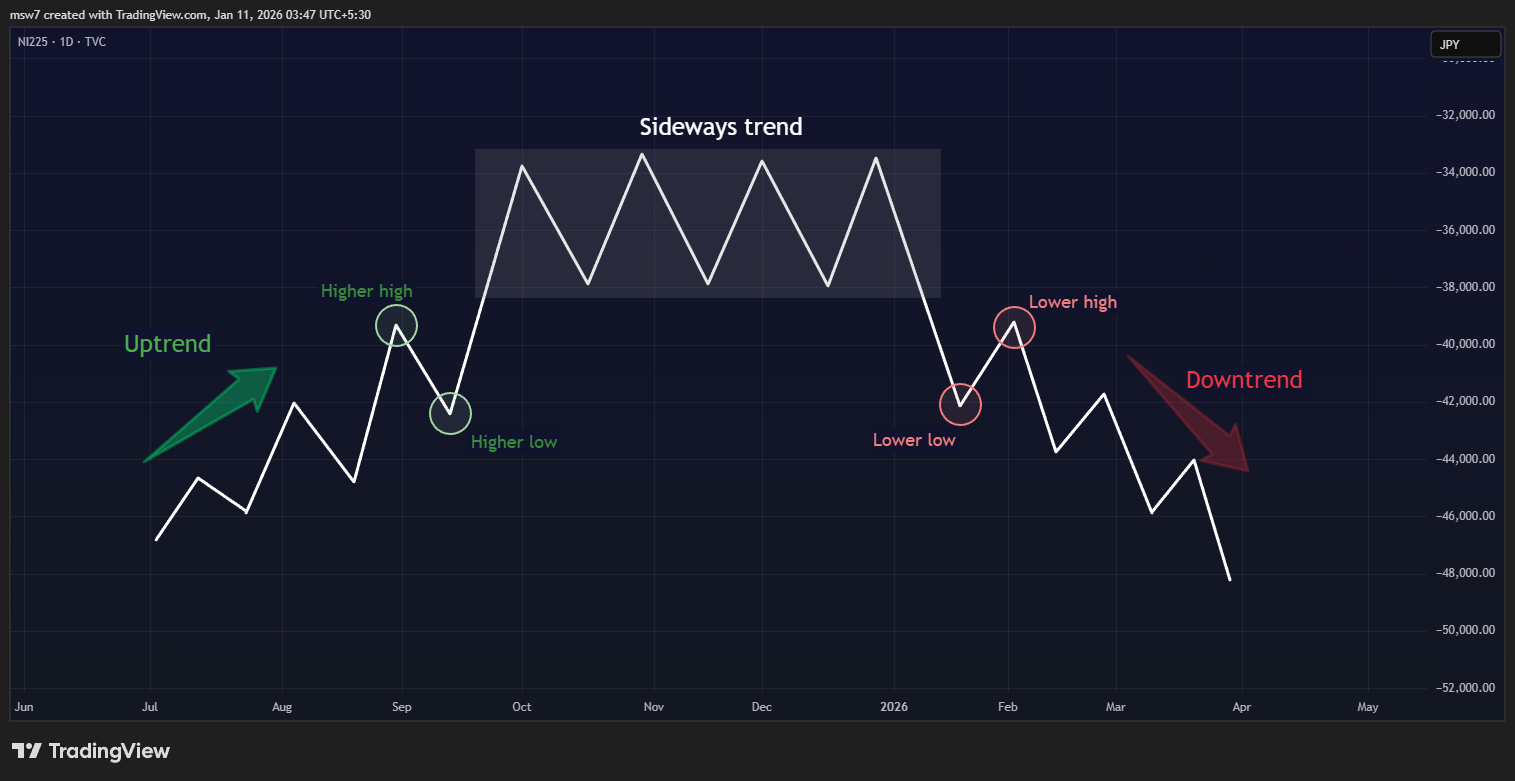
Ideally, the price should be rising or moving from a consolidation phase into a growth phase. It’s the ideal setup for a momentum strategy since it often struggles in those messy, unpredictable markets. To spot good entry points, look for clear trends: higher highs and higher lows in a bull market, or lower highs and lower lows in a bear market.
Zeiierman’s Trend Algo is a handy tool for checking if the overall trend is set or if the market is stuck. When the Trend Algo shows a steady direction, and prices follow that path, it’s a good time for momentum trading. If the signals are flipping a lot, that usually means the momentum is weak, and the trading conditions aren’t excellent.
Step 2: Confirm Momentum Strength
A trend alone isn’t enough; you’d need momentum behind it, too. Price should expand decisively in the trend direction and pause briefly before continuing, rather than retracing deeply or stalling repeatedly.
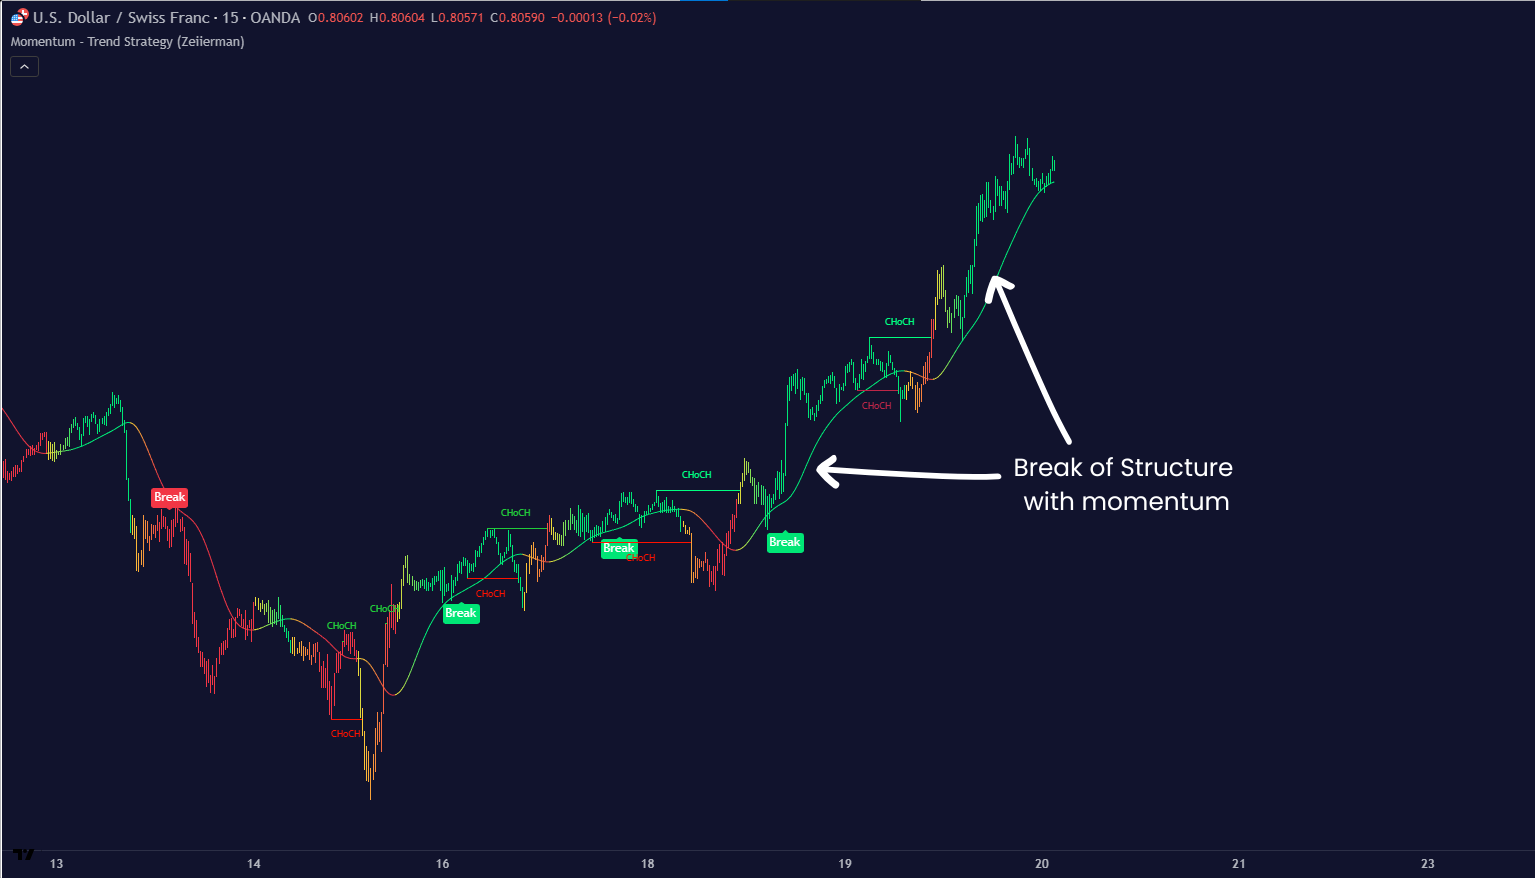
Our tools, such as Z Algo and the Momentum Trend Strategy, help identify whether price movement is supported by acceleration or merely drifting. Strong momentum appears as clean impulse moves followed by controlled pullbacks. When momentum is weak, the price struggles to extend and repeatedly overlaps the previous structure.
Step 3: Wait for Structured Entry Zones
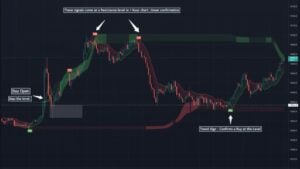
My advice is to wait for areas where risk is clearly defined. The first setup to look for is a pullback in a strong momentum trend. This happens when the price dips a bit after a sharp move, then steadies without much pushback in the opposite direction. You can use Smart Range to determine whether this pause is a good sign or a sign that it’s falling apart.
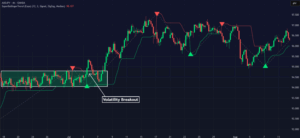
Read: How to Combine Liquidity Sweeps with Fair Value Gaps (FVGs)The second setup is a continuation breakout after a low-volatility squeeze. The price should now move sideways before breaking out in the same direction as the trend. Momentum Breakout Pro will help filter for breakouts with genuine volatility expansion, not just line breaks.
Step 4: Execute with Defined Risk and manage the trade
Look for the price to show confirmation in the zone before you enter the trade. I place my stop losses where the momentum clearly isn’t reaching anymore, like just below a higher low in bullish trades or back inside a range that just broke.
Using the ATR + PSAR Trailing Stop makes it easier to see where to set stops based on volatility. This way, you won’t get shaken out by normal price swings, but you’ll still keep your capital safe. Make sure to adjust your position size so that any potential losses stay manageable if the momentum shifts.
You can take any exit as long as the price respects the structure and the momentum tools remain supportive, the trade is allowed to develop. The stop orders are trailed as new structure forms, and partial profits can be taken near key levels without cutting the trade short.
3. Tools Commonly Used in Momentum Trading
Momentum traders use indicators as supporting tools to make better decisions in fast-moving momentum environments. Of course, you don’t need to use the exact tools I recommend; you can look for alternatives made by the trader of your choice.
A. Moving Averages as Structural Guides
Moving averages are great for smoothing out price fluctuations and giving some context. When the market is really moving, prices are usually above the key moving averages during bullish trends and vice versa. Instead of treating moving averages as perfect entry points, momentum traders focus on how the price behaves around these levels.
A standard 20-period Simple Moving Average (SMA) is blind to volatility. If the market suddenly becomes hyper-volatile, that 20-period line stays the same, often leading to whipsaws where the price dips just below the line, triggers your stop loss, and then rockets back up.
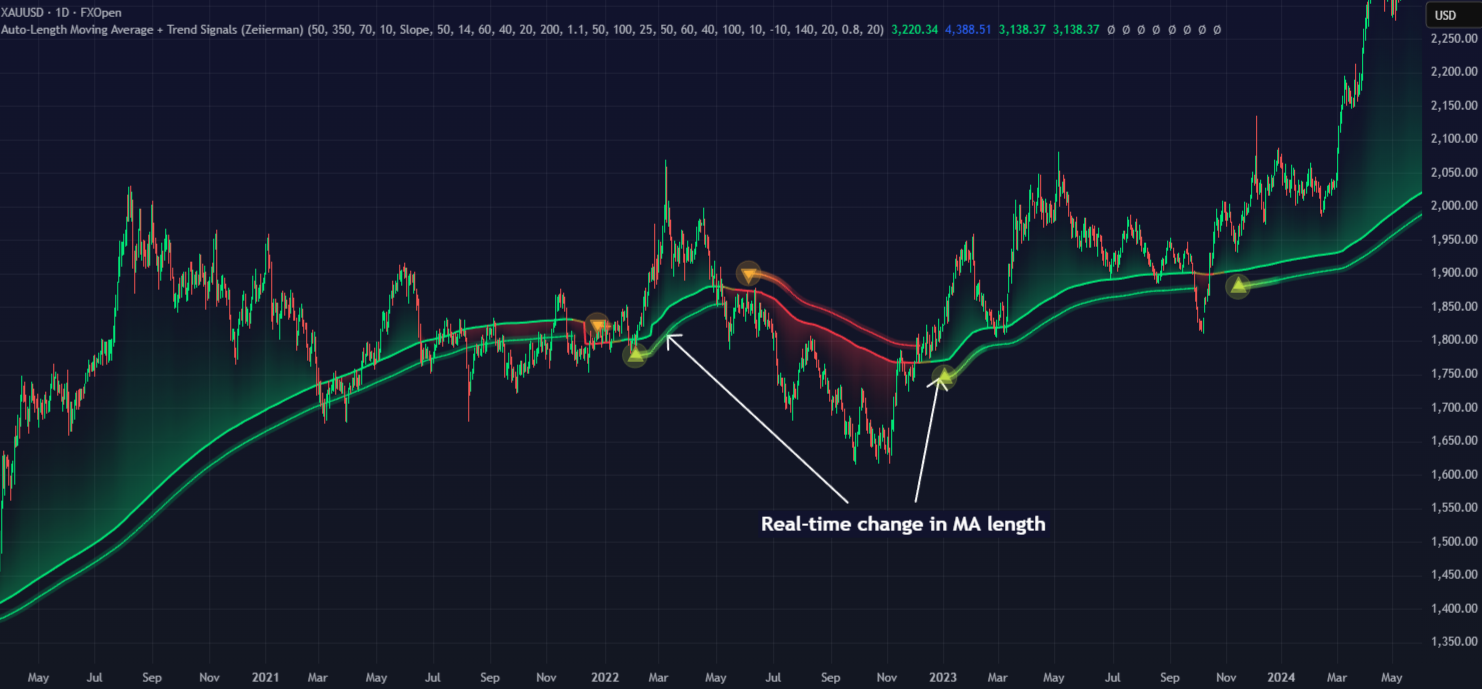
Most of our community members use the Zeiierman Auto-Length Moving Average, which solves that problem exactly. So instead of you picking a number like 20 or 50, the indicator uses an algorithm to detect the current market cycle.
B. RSI and Momentum Regimes
The Relative Strength Index (RSI) is a popular momentum indicator for traders. Still, many new traders misuse it. RSI is much more than an indicator of overbought or oversold conditions.
When there’s strong bullish momentum, RSI often stays at elevated levels, with pullbacks staying above the mid-range, which shows there’s solid buying pressure. On the other side, in bearish momentum, RSI tends to stay low and has a hard time bouncing back.
To achieve this, I recommend Zeiierman’s Momentum-Trend Strategy and Reversal Algo. These indicators can help you filter signals based on momentum.
You can use the Momentum-Trend Strategy for the strength of the momentum and use the Reversal Algo as an added confirmation when both align on your chart.
C. Volume as Confirmation
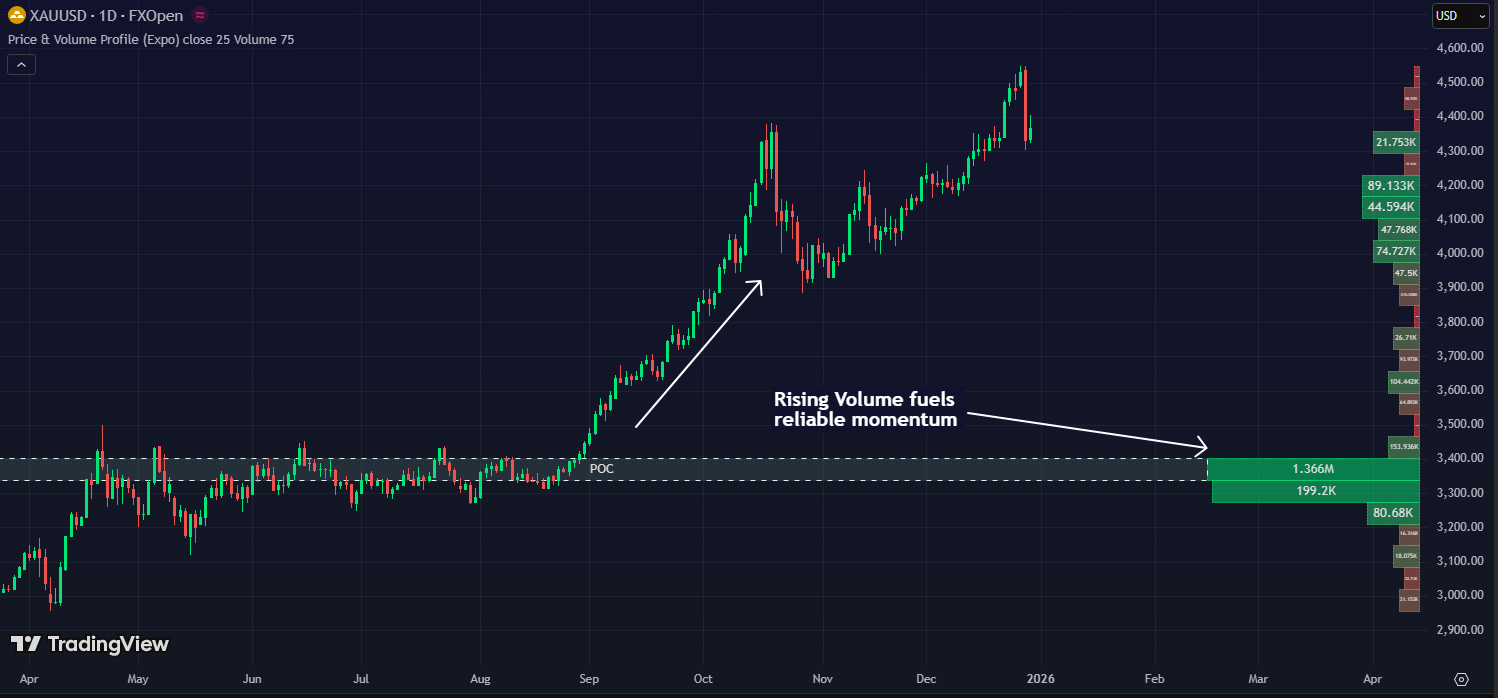
Volume is a crucial confirmation tool in trading. It helps determine if a price change is supported by strong participation or just drifting along because there’s little resistance. Typically, when momentum is strong, you’ll see increasing volume during those big price moves. During healthy pullbacks or consolidations, volume tends to drop, suggesting that any opposing trends are weak.
Momentum traders like to look at current volume relative to recent trends rather than in isolation. Breakouts that come with rising volume and follow-through are generally much more reliable. You can use the Price & Volume Profile indicator to gain a comprehensive view of volume distribution over a longer time frame.
4. Momentum Trading vs Other Trading Styles
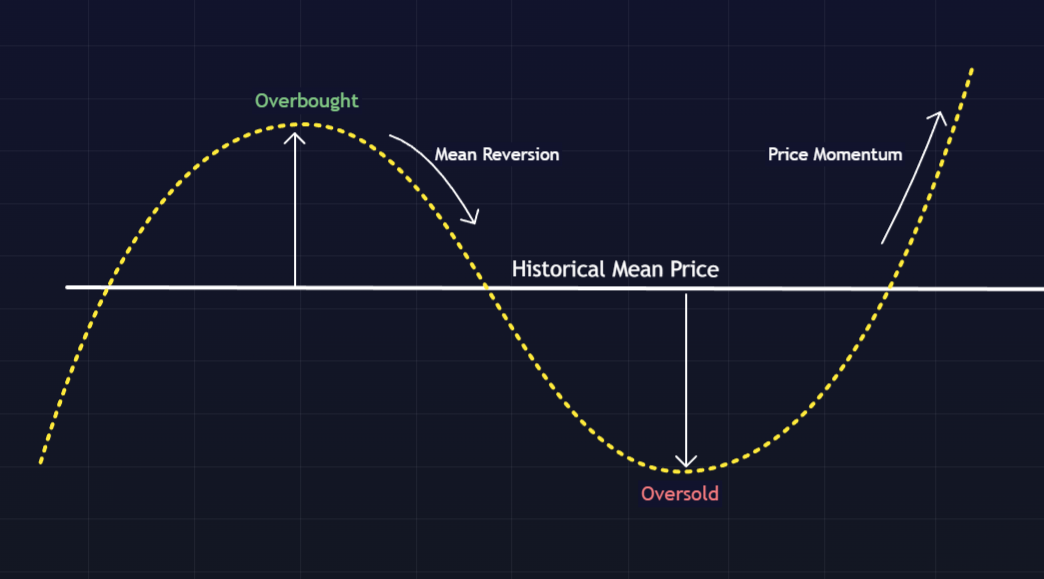
A. Momentum Trading vs Mean Reversion
Mean reversion strategies are based on the idea that prices will eventually revert to an average or stable level. On the other hand, momentum trading assumes that prices can keep moving away from that average as long as the trend remains strong.
Both methods can be profitable when performed well in different market conditions. Momentum trading works well in trending and volatile markets, while mean reversion is more effective in stable, range-bound environments. The problems come when traders try to apply momentum strategies in markets that aren’t trending, or when they try to counteract strong trends just because prices seem overhyped.
B. Momentum Trading vs Trend Trading
Momentum trading and trend trading are similar, but they’re not the same. Trend describes direction, and momentum describes the rate of change. You can have an uptrend with weak momentum (grindy advances) or a sharp momentum burst against a larger downtrend.
Experienced traders know how to blend these two approaches. The trick, which I focus on, is to use the trend to set their overall view and momentum to nail down their entry points.
Zeiierman
With over 16 years in the market, Zeiierman has extensive experience as a full-time trader and risk advisory consultant for hedge funds. He has developed many profitable trading strategies, drawing on his background in risk management and strategy execution.
More from Zeiierman