A Dragonfly Doji is a single-candle pattern where the open, high, and close are at virtually the same level, and the session’s low forms a long lower shadow. It signals that sellers dominated early, but buyers regained control by the close, making it a potential bullish reversal clue—especially when it appears after a down-trend and is confirmed by high volume.
You may have seen the market open and start bleeding instantly. Here’s how a Dragonfly Doji would play out: sellers are in control, pushing prices down hard throughout the session. But then, out of nowhere, the buyers step in, driving the price right back up to where it started.
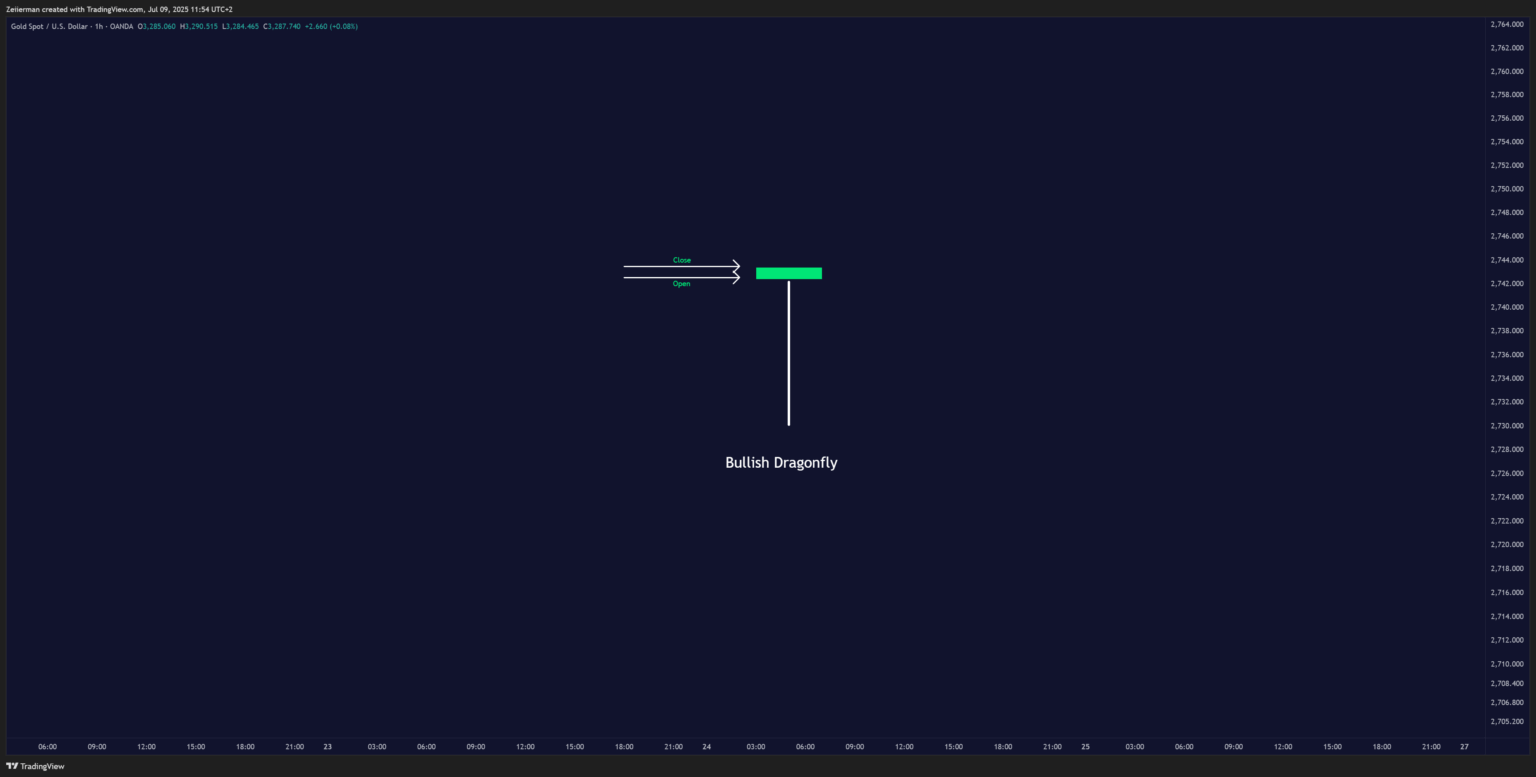
By the time the session closes, you’re looking at what seems like a tug-of-war with no clear winner. That turning point right there is the Dragonfly Doji. Visually, it looks like a uppercase “T.”
A true Dragonfly Doji, as popularised by Steve Nison’s work, has three key features that you can’t ignore:
- A long lower shadow, which is at least twice the length of the body, sometimes way more.
- Ideally, no upper shadow, but a tiny one won’t kill the pattern.
- Open and close prices that are practically identical or close such that a microscopic body is created.
1. What the Dragonfly Doji Tells You About the Market
Understanding why a Dragonfly Doji forms is just as important as spotting it.
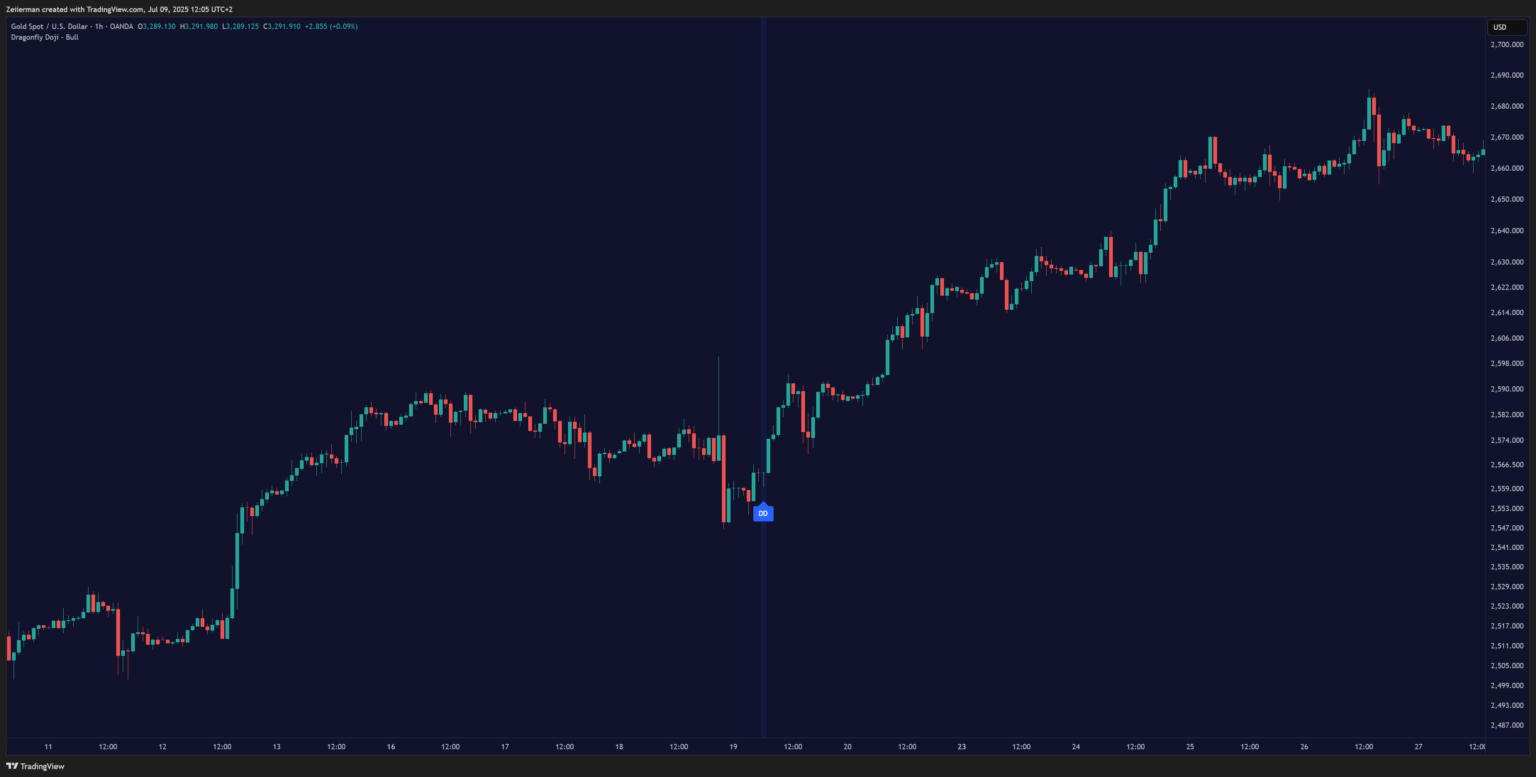
A Dragonfly Doji means different things depending on where it shows up. In a downtrend, it’s often a reversal signal – bears have exhausted themselves, and bulls are ready to take control. The longer the downtrend before the pattern, the more significant the potential reversal.
In an uptrend, dragonfly patterns are trickier. They might signal a temporary pullback rather than a full-on reversal. I always look for additional confirmation when betting against a strong uptrend.
Sideways markets present the biggest challenge. Dragonfly Dojis in trading ranges often lead to false breakouts in either direction. The key is identifying genuine S/R levels versus temporary consolidation zones.
Moreover, you have to understand the market dynamics in the Dragonfly Doji session. Big players often accumulate at this point. They let retail traders panic-sell into the lows, then step in with size to push prices back up.
The beauty of the Dragonfly Doji lies in its indecision. Neither bulls nor bears achieved a decisive victory, which means the next catalyst could tip the balance dramatically. Our job is to position for profit from whichever direction wins out.
2. How to Spot a Perfect Dragonfly Doji
To spot a Dragonfly Doji candlestick pattern perfectly, you’ll need to check and confirm three things on your chart.
First, we check the length of the lower shadow. If the lower shadow isn’t at least double the body size, you’re looking at an impostor. The best Dragonfly Dojis have shadows that are 3 to 5 times longer than the body because that extreme rejection of lower prices is what gives this pattern its predictive power.
Next, we’ll check the length of the upper shadow. The upper shadow should be minimal or nonexistent. A tiny upper wick is fine, of course. Neither markets nor neither are patterns, but if you’re seeing an upper shadow that’s more than 25% of the lower shadow’s length, move on. That’s not your dragonfly.
Read: How to Trade Wedges Like a Pro: Rising & Falling Wedge Strategies ExplainedFinally, body size matters too. We want the open and close to be as tight as possible. In a perfect world, they’d be identical, but real markets have slippage and spread. A body that’s less than 10% of the total candle range usually does the trick.
Here are some other patterns that are often mistaken for Dragonfly Doji:
| Pattern | Shape | Body Position | Wick Configuration | Psychological Meaning | Typical Use Case |
|---|---|---|---|---|---|
| Dragonfly Doji | “T” shaped | None or very small | Long lower wick, no upper wick | Sellers lost control; buyers pushed price back — bullish reversal | Appears after downtrends or near support |
| Hammer | “T” like, with a body | Small body near the top | Long lower wick, small or no upper wick | Buyers fought back after sellers dominated — bullish signal | Reversal pattern after a downtrend |
| Gravestone Doji | Upside-down “T” | None or very small | Long upper wick, no lower wick | Bulls lost momentum; sellers regained control — bearish reversal | Appears at the top of an uptrend |
| Inverted Hammer | Inverse of Hammer | Small body near the bottom | Long upper wick, small or no lower wick | Buyers tried to reverse the trend but lacked confirmation — potential bullish reversal | Appears after a downtrend |
| Long-Legged Doji | Cross or plus sign | None or a tiny body in the centre | Long upper and lower wicks, near-equal | High indecision; bulls and bears were equally strong, a neutral signal | Sideways or low-volume markets |
| Spinning Top | Small body with short wicks | Body centered | Small upper and lower wicks | Low conviction in either direction — neutral signal | Appears during consolidation or low volatility |
Don’t confuse Dragonfly Dojis with Hammer candlesticks. Hammers have more definite bodies and can appear in uptrends as continuation patterns. Dragonfly Dojis are all about their paper-thin bodies and the indecision they represent.
Shooting Stars often cause confusion as well. Sometimes, a failed shooting star (with a tiny lower shadow instead of an upper) gets mistaken for a dragonfly.
Lastly, Pin Bars cause another type of confusion. These patterns have a small body offset from the long wick. The dragonfly’s body is at the tip of the wick.
📌 The bottom line is this: No upper wick + long lower wick + close at high = Possible Dragonfly.
3. What is the Dragonfly Doji trading strategy?
Strategy #1: The Bounce Play
This is the most straightforward approach and perfect for beginners who want clean entry and exit rules.
- Entry trigger: Wait for the next candle after the Dragonfly Doji to close above the Doji’s high. This confirms that buyers are ready to step in with conviction.
- Stop loss placement: Set your stop just below the Dragonfly’s lowest point (the end of that long lower shadow). This gives the trade room to breathe while limiting the downside if you’re wrong.
- Profit targets: Look for the next significant resistance level, which is typically the previous swing high, or use a 2:1 risk-reward ratio.
- Position sizing: Never risk more than 1-2% of your account on any single trade, no matter how confident you feel. Even the best patterns fail sometimes.
Strategy #2: The Breakout Follow-Through
This approach requires more patience but often produces cleaner, more sustained moves.
- Setup: After identifying your Dragonfly Doji, wait for 2-3 confirmation candles to form. You must watch out for consistent buying pressure, not just one lucky bounce.
- Entry criteria: Look for volume expansion above the breakout point, following the pattern’s high. A higher volume suggests institutional participation, which increases your chances of success. Otherwise, you might walk into a trap.
- Multiple-timeframe confirmation: Check the weekly chart to ensure you’re not fighting the larger trend. A daily Dragonfly Doji in a weekly uptrend has much better odds than one fighting a weekly downtrend.
- Risk management: Use a wider stop (perhaps 1.5 times the Doji’s range) to achieve a more conservative entry. You can put your primary target at the nearest volume gap or resistance zone. The secondary target can be a 1:2 risk-reward minimum.
Strategy #3: The Support Level Combo
This is an advanced play that combines multiple technical factors to create higher-probability setups.
- Setup: You’re looking for Dragonfly Dojis that form precisely at key support levels, such as major moving averages, trendlines, or previous important lows. This confluence dramatically increases the pattern’s reliability.
- Additional confirmation: Look for oversold readings on RSI (below 30-50), MACD showing bullish divergence, or price touching the lower Bollinger Band. The more factors align, the better.
- Entry and Risk Management: You can often enter closer to the Doji’s low when you have strong support confluence, which improves your risk-reward ratio. I typically recommend scaling into the position. Initially, start with 50% size and then add more if the trade moves in your favor.
4. When the Dragonfly Doji Actually Works
This is where 90% of traders screw up. A Dragonfly in the wrong spot is worse than useless. Always remember to zoom out and look at the bigger picture because context is everything.
Here’s when a Dragonfly Doji actually works:
- After a clear downtrend, it signals a possible reversal.
- At a support level, this suggests the price rejected lower levels.
- High volume during the formation suggests institutional participation. When big money steps in to reject lower prices, retail traders should probably listen.
- With volume confirmation, a spike adds weight to the reversal signal.
Daily charts are your sweet spot for Dragonfly Doji hunting. They capture a full day’s worth of market emotion and give big players enough time to show their hand.
5. When Dragonfly Dojis Fail (and How to Avoid Getting Burned)
Even the best patterns fail sometimes, and Dragonfly Dojis are no exception. The difference between profitable and broke traders isn’t avoiding all losing trades. It’s knowing when the odds are stacked against you.
Low-volume patterns are your first warning sign. If the Dragonfly Doji forms on light volume, it means nobody important was paying attention. Without institutional participation, these patterns typically fade away within a few sessions.
High-volatility, news-driven days wreak havoc on technical patterns. If the Dragonfly Doji forms on earnings announcement day or during a major economic or geopolitical event, the pattern’s reliability drops significantly. This is a situation where experience of market fundamentals will take priority over technical analysis.
Strong trend continuation phases are pattern killers. When momentum is overwhelming in one direction, reversal patterns like Dragonfly Dojis often get steamrolled by the overall forces.
Think of it like a weather forecast — a Dragonfly Doji might suggest rain is coming (reversal), but do not bring out the umbrella if you don’t see clouds (volume + context + confirmation).
6. Tools to Help You Spot Dragonfly Doji Patterns
I. Smart Reversal Indicator / Reversal Bands
Our Reversal Bands script on TradingView is designed to detect key reversal candles, including Dragonfly Dojis. It adds context by overlaying momentum filters (e.g., RSI, volume) or institutional-grade confirmation. The script also automatically plots S/R level zones to help assess whether the pattern occurs near a meaningful price level.
Get access to Reversal Bands & Zones.
II. Curved Smart Money Concepts Probability
The Curved Smart Money Concepts Probability indicator focuses on the “Smart Money” structure to identify potential market reversals using probability data. It tracks institutional-strength grounds, such as Break of Structure (BOS) and others, to present win-loss ratios.
When a Dragonfly Doji appears near these zones, this indicator can signal higher confidence setups. It adapts its sensitivity based on trends, making it effective across different timeframes.
Get access to Curved Smart Money Concepts Probability.
III. Volume Profile (Visible Range / VPVR)
Zeiierman’s Volume Profile indicator tells you where the real buying and selling is happening, not just where prices have moved. Volume Profile shows you which price levels had the most trading activity. When a Dragonfly Doji forms right at a high-volume area or the Point of Control (POC), it shows that buyers defended that zone heavily. This makes the pattern more reliable.
Get access to Volume Profile (Visible Range / VPVR).
Frequently Asked Questions (FAQs)
I. Is a Dragonfly Doji bullish or bearish?
A Dragonfly Doji is typically a bullish reversal signal. Its long lower shadow indicates that sellers pushed the price sharply downward, but the buyers stepped in and drove it back to (or near) the open by the close.
That intraday “power shift” suggests demand is starting to outweigh supply, so traders watch for confirmation on the next candle, such as a higher close or a break above nearby resistance, before labeling it a true bullish turnaround.
II. Is a Dragonfly Doji red or green?
A Dragonfly Doji can appear either red or green on your chart because the open and close are virtually identical. If your platform colors a candle red when the close is even one tick below the open, you’ll see a red (bearish-colored) Dragonfly; if the close is equal to or a fraction above the open, it will print green.
The color isn’t the key factor—the candle’s long lower shadow and tiny or nonexistent real body are what define a Dragonfly Doji.
III. What confirms a Dragonfly Doji reversal?
A Dragonfly Doji pattern gains credibility when the very next candle closes above the Doji’s high (in an up-reversal scenario) on heavier-than-average volume. We also like to see a concurrent break of a minor resistance level or a bullish momentum indicator cross (e.g., the RSI ticking up from oversold territory). Without that “follow-through” bar, a single Dragonfly Doji is only a caution flag, not a confirmed trend change.
IV. Where does a Dragonfly Doji carry the most weight?
The pattern is most powerful when it forms after an extended decline and right on, or just under, a clear support zone—such as a prior swing low, a major moving average, or a Fibonacci retracement level. In those locations, the long lower shadow signals an aggressive liquidity sweep that fails, hinting at capitulation by sellers and a potential bottoming process.
V. How do traders set stop-loss levels when trading a Dragonfly Doji?
At Zeiierman Trading, we recommend placing the stop just below the Doji’s lower shadow because a move under that extreme would invalidate the candle’s bullish message. Some traders widen the stop by a few pips to avoid being shaken out by noise, or they anchor the stop beneath the next support level if the shadow is unusually long.
The key is to align position size so that the distance to the technical stop equates to a risk level you can accept (often 1% of account equity or less).
VI. Does the timeframe affect the effectiveness of the Dragonfly Doji?
On daily and weekly charts, a Dragonfly Doji typically signals a stronger reversal because each candle reflects an entire session (or more) of trading psychology. Intraday Dojis—on 5- or 15-minute charts, for example—appear more frequently and therefore generate more noise; they’re best traded only when they align with higher-timeframe structure or major news catalysts.
In short, the longer the timeframe, the higher the pattern’s reliability.
VII. Is the Dragonfly Doji useful in crypto and forex, or mainly in equities?
The Dragonfly Doji works across all liquid markets—equities, forex, futures, and especially crypto, where stop-hunts and emotion-driven swings are common. The core logic (sell-off rejected, buyers regain control) is rooted in crowd behavior rather than the asset class. You should, however, account for each market’s quirks: 24/7 trading in crypto can blur “session” closes, while high-leverage forex pairs may require tighter confirmation rules to filter false signals.
SM_Trader
SM_Trader is a highly experienced coder and strategy developer who brings the most complex algorithms to life. As a member of MENSA, the prestigious organization for individuals with intelligence scores in the top 2% of the world, he combines exceptional analytical skills with a keen eye for numbers and statistics, empowering businesses to grow at the right pace and in the right direction.
More from SM_Trader