Back when I started trading, I believed the market had it out for me. There were many times when the price dropped soon after I bought in. And I didn’t know what to do at the time, do I cut my losses and get out, or do I hold?
While those two can be good options, sometimes, the answer is neither. There are times when the right call is to BUY MORE after a price drop.
According to the averaging down trading strategy, you should buy additional units at lower prices to reduce your overall entry cost. While it sounds smart, it is as risky as it can be rewarding. Whether you should buy in further or get out depends on several factors that govern this technique, such as volume, volatility, market sentiment, external/real-world news of the stock/company, and more.
Of course, you don’t have to worry about a lot of these. For I have created the Average Down Indicator for my Zeiierman community. It helps with following average price, P&L, and a couple more things, so you plan accordingly.
But wait…I am getting ahead of myself. First, let me explain the averaging down strategy properly. It’s important for you to understand when this strategy makes the most sense. And when you must avoid averaging down.
1. What is Averaging Down trading?
Averaging down is an investing strategy where you buy more shares of a stock or asset after its price has dropped. The goal is to lower the overall average price you paid for your entire position. This way, if the price eventually recovers, you can reach the breakeven point and potentially turn a profit quicker than you would have with your original shares.
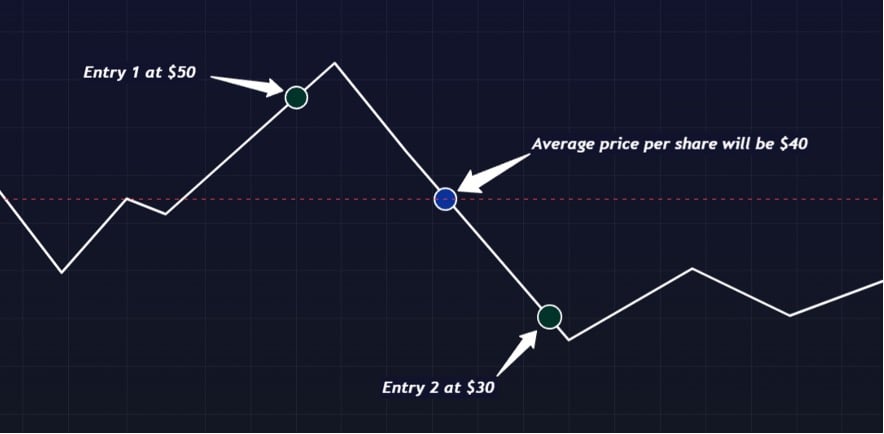
Let’s use an example: Say, you bought 100 shares of AAPL at $50 per share. Your total investment is $5,000. When the price dropped to $30, you followed the averaging down strategy and bought another 100 shares at the new price, costing you $3,000.
Now, you have a total of 200 shares for a total investment of $8,000. Your new average cost per share is $40 ($8,000 divided by 200 shares).
Achievement: Before you averaged down, you needed the stock to get back to $50 to break even. Now, you only need it to climb back to $40.
When should you buy the dip?
- Strong fundamentals
Always stick to assets with proven staying power. In equities, that means blue-chip companies with healthy earnings and a history of growth. In crypto, Bitcoin or Ethereum are projects with network adoption, liquidity, and now have institutional backing.
Averaging down in these cases is less about “gambling on a bounce” and more about buying quality at a discount.
- Temporary drops
Markets often overreact to short-term news like an earnings miss, a regulatory headline, or sudden risk-off sentiment. If the bigger trend or fundamentals remain the same, these temporary dips can present an opportunity. Averaging down here lets you capitalize on short-lived fear in the market.
- Pre-planned scaling strategy
Smart traders never average down blindly. Start by mapping out support levels in advance and set alerts or staggered buy orders with handy tools like the Average Down Indicator. By planning your scaling, you’re not reacting emotionally to a falling price but following a structured way.
- High conviction trades
Sometimes your analysis gives you a strong conviction, like maybe volume profiles show major accumulation, or long-term technicals point to strong support. If you’ve built those confluences and risk is defined, averaging down becomes a calculated move rather than a desperate one to keep the trade.
Read: The Most Accurate Trading Indicators in 2026When to avoid averaging down?
The fastest way to blow up an account is to average down in the wrong environment.
- Free-falling assets
If a stock or coin is in an uncontrollable downtrend with no technical support nearby, adding more is just catching a falling knife. These setups can wipe you out before you realize the mistake. This often happens in the cryptocurrency space, where coins are hyped up without any real value, and most traders try to ride the hype but fail miserably.
- No stop-loss rules
Without a defined exit, averaging down can become a bottomless hole in your wallet. If you’re just buying more because the asset is cheaper now, you’re not executing a strategy, you’re gambling because of loss aversion. Always have a hard stop-loss, whether mental or on the charts.
- Low-liquidity markets
In stocks without liquidity or shit altcoins, averaging down can trap your money for months or years. Even if the price recovers, getting your capital out at a decent price can be nearly impossible. So always confirm that an asset has significant liquidity historically and in real time.
- Using Leverage
If you have an open trade with high leverage, then averaging down can be extremely dangerous because if the stock price continues to decline, you could face a margin call, forcing you to deposit more funds or close the position at a large loss. In a long downtrend, this almost always wipes out the accounts of traders and even puts them in debt.
Read: How to use Moving Averages to improve your day trading performance?2. How to execute Averaging Down trading strategy?
First, let’s get one thing straight: averaging down is not a way to save a bad trade. It’s a calculated strategy you planned from the start, before placing your very first order. If you’re buying more because you’re panicking and trying to break even, you’ve already lost a step.
Step 1: Pre-Trade Planning
From your point of view, averaging down shouldn’t feel different from scaling into a position. Instead of putting all your money on the table, you’re breaking your total position into smaller chunks. This can also be practised when you want to react to a drop in position, but you must study the charts to make sure that the price has a good probability of bouncing back.
Set Your Total Risk: Decide on the maximum amount of your trading capital you are willing to risk on this one trade. For example, if you have a $10,000 account and a 1% risk per trade rule, you might decide your maximum loss on this entire strategy is $100.
Decide Your Entry Zones: This is where technical analysis comes in, look for:
- Major Support Levels: Where has the price bounced before?
- Moving Averages: Is the price dropping to a key moving average, like the 50-day or 200-day?
- Key Fibonacci Retracement Levels: Does the price drop align with a 50% or 61.8% retracement from a previous high?
Pro Tip: You’re looking for areas where you expect a bounce, not just a lower price.
Instead of one big order, you will have multiple small orders ready. For example, you might decide to split your total position into three parts. You’ll place your first order at your initial target price, your second at the next support level down, and your third at the final, strongest support level.
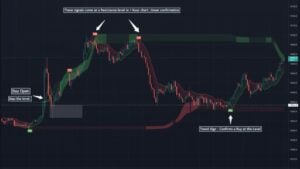
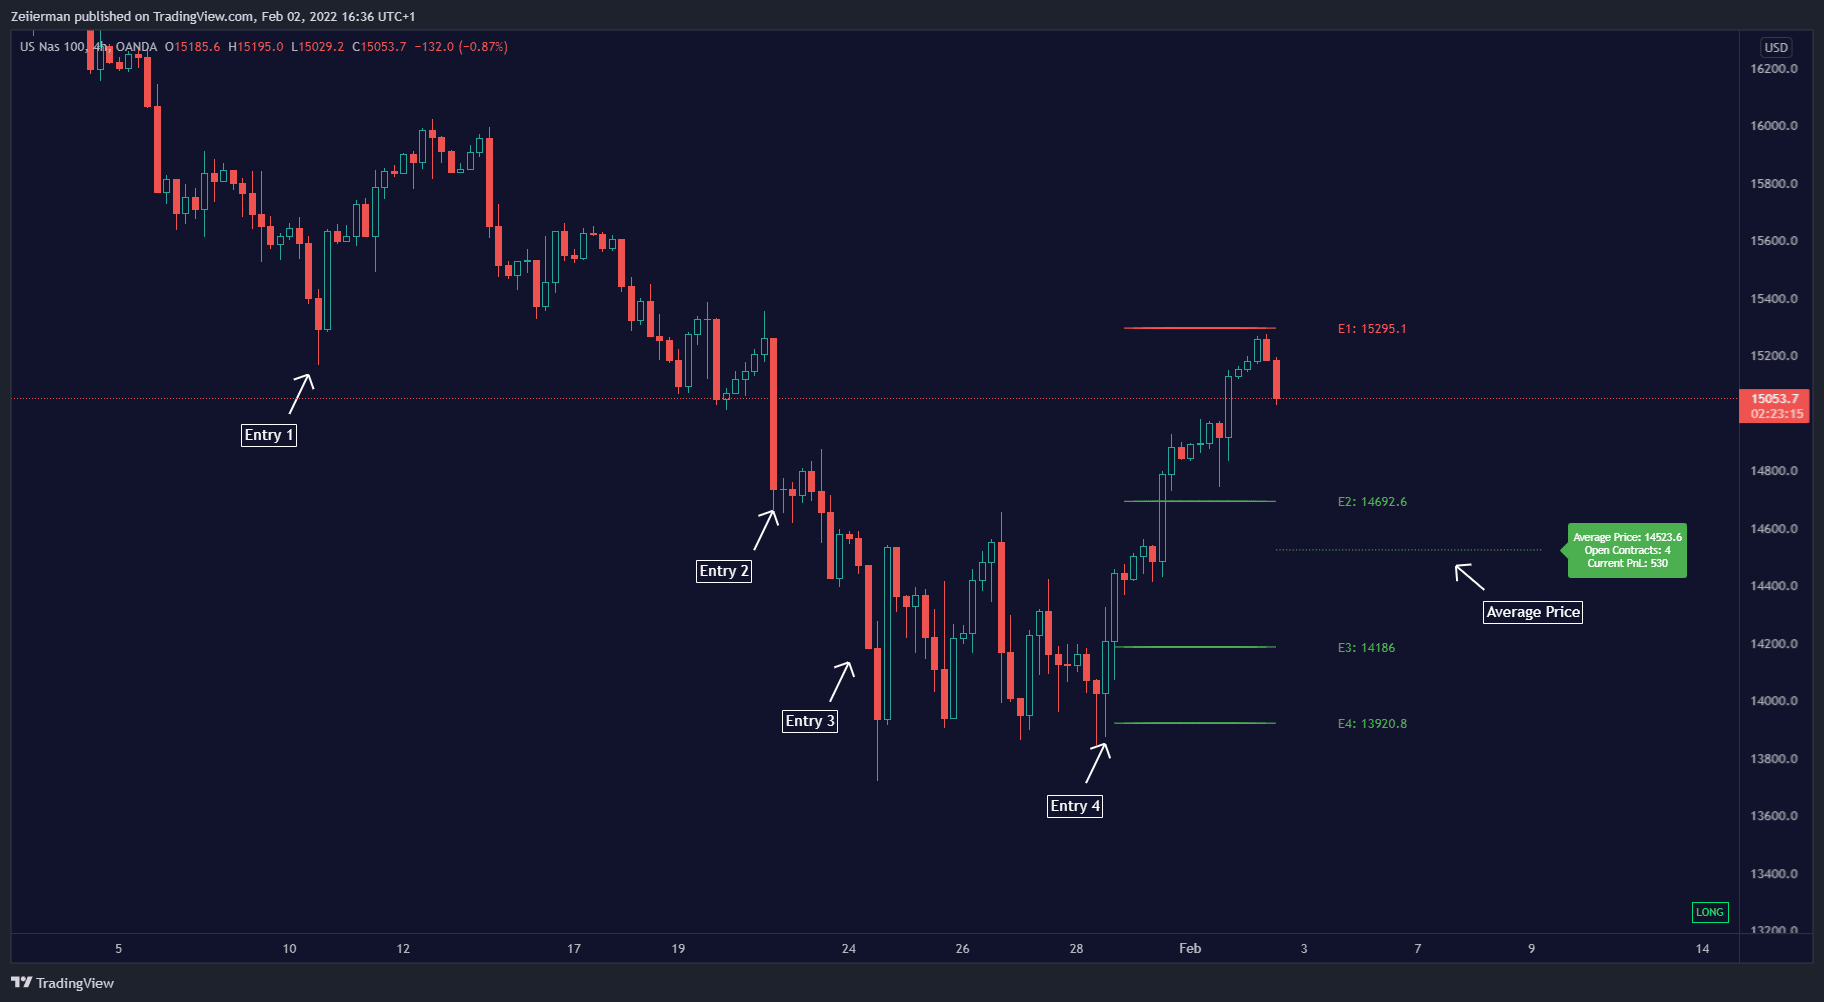
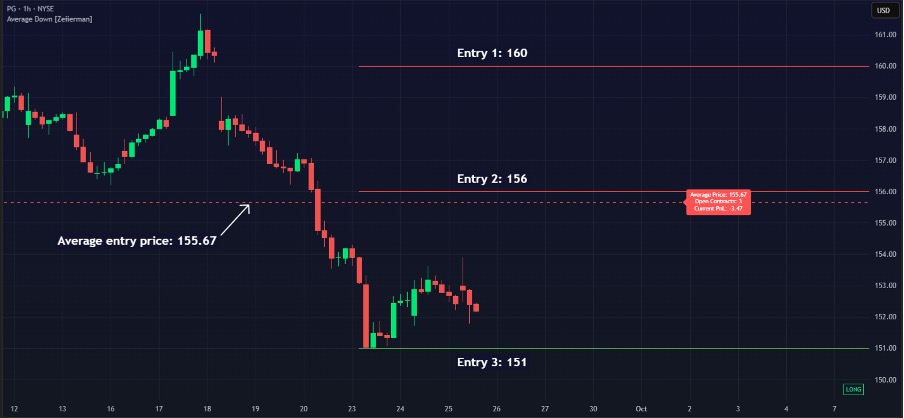
For this, you can use our Average Down indicator on TradingView, which helps traders and investors get the average price of their position before activating positions. The tool works for both Long and Short and displays the entry price, average price, and the P&L on the chart itself. Unlike manual averaging down, Average Down script gives structure and avoids emotional mistakes that are prone to happen in panic mode.
Here’s an example of a long position:
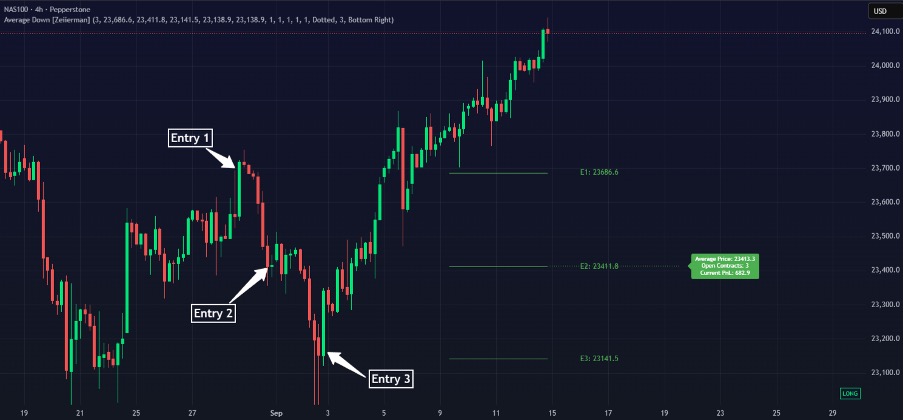
Zeiierman’s Average Down Tool can pre-map these entries and instantly calculate what your average cost will be after each one. This way, you know your breakeven before entering.
Step 2: Sizing Your Positions
This is the most critical part of the strategy. It’s a huge mistake to make all your buys equal. As the price drops, your risk for each subsequent buy gets smaller, so your position size can get bigger.
You can use a formula to calculate your position size for each entry. The formula is:
Position Size = Total Risk / (Entry Price – Stop Loss)
Example: Let’s say your total risk on the trade is $100. You plan two entries:
Entry 1: Buy at $50, with a hard stop-loss at $45. Your risk per share is $5. So, your position size for this first buy is $100 / $5 = 20 shares.
Entry 2: If the price drops to a support level at $45, you buy again. Your stop-loss is still at $45. Your risk per share on this second buy is now $0. The closer you are to your stop-loss, the bigger the position you can take to maintain the same dollar risk.
This is a simplified example, but the principle is clear: you are using a fixed dollar risk and letting your position size adjust. This is a structure that a beginner needs to play in the league with the other experienced players in the market.
Read: Top 10 Indicators for the Stock Market in 2025Step 3: Execution and Risk Management
Once your plan is set, you need to be objective and not let emotions get in the way.
Enter the First Position: Place your initial order at your pre-determined price.
Set Your Stop-Loss: This is your safety net. Immediately place a hard stop-loss order at your planned exit price. This is your insurance policy. If the stock blows right past all your support levels and keeps falling, you get out. Period. No questions asked.
Wait for the Next Entry: If the stock drops, great. Your plan is working. Wait for it to hit your next entry point and execute the order. But if it doesn’t hit your next entry and goes up, that’s okay too. You still made money on your first buy.
Know When to Walk Away: The moment the stock breaks your final, hard stop-loss, you exit the entire position. No exceptions. This prevents a small loss from becoming a career-ending one.
Averaging down for a trader is a systematic, technical approach to building a position. It’s not an emotional response to a losing trade. It’s a calculated way to increase your potential profit while keeping your risk under control.
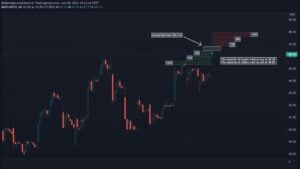
Here, we have used the Average Down tool to map out the entry points and get the average price of the three entries.
Averaging Down vs. Other Strategies
1. Dollar-Cost Averaging (DCA):
With DCA, you invest a fixed amount at regular intervals, regardless of price. Over time, you buy more when prices are low and fewer when they are high. DCA is systematic and time-based because you’re automatically buying dips without even thinking about it. Averaging down is different because it’s reactive, and you only invest extra when the stock actually falls, and typically only if you already own it.
Basically, averaging down is “buy the dip” a little aggressively, whereas DCA is periodic buying based on the condition that the asset is absolutely worth holding. Both lower your overall cost basis over time, but DCA avoids timing moves entirely.
An example of DCA in practice is the firm MicroStrategy, which holds 638,460 bitcoins bought at various price points (high or low), with an average price per coin being $73,880.
2. Averaging up
Averaging up is the mirror opposite of averaging down. Instead of buying when your investment is losing value, you add more money once it starts working in your favour.
Say you bought 50 shares of a stock at $50. The stock climbs to $60, and instead of just holding, you buy another 50 shares. Now your average cost moves to $55, but you’re sitting on an unrealised gain across the position.
The main belief here is that strength tends to attract more strength. Momentum investors often rely on this, betting that the crowd and institutional money will continue to push prices higher once a breakout happens.
Why do some traders prefer it:
- It leans into winners rather than tying up cash in losers.
- Psychologically, it’s easier to add to a green trade than to double down on a red one.
- It naturally aligns with trend-following strategies, which are used quite often by traders.
3. Value Averaging
Value averaging is not as well-known as dollar-cost averaging (DCA), but it’s worth a shot. Unlike averaging down or up, it doesn’t just react emotionally to price moves. It follows a growth plan for your portfolio.
Instead of investing a fixed dollar amount every month (like in DCA), you decide how much you want your portfolio to be worth at each point in time. If your portfolio lags behind that target, you contribute more. If it’s ahead, you contribute less or sometimes nothing at all.
For example, let’s say you want your investment account to grow by $1,000 each quarter. If, after three months, the account only grew by $500, you’d invest an extra $500 to get it back on track. If the account already grew by $1,200, you might add nothing or only add $800 to hit your $2,000 target.
Why is it considered by some investors:
- Counter-cyclical by design because you invest more after drops and less after rallies. This forces you to buy more during dips and buy less during rallies, which is the opposite of emotional crowd following behaviour.
- More systematic than averaging down because the decisions aren’t based on gut feelings but on a predefined growth path.
- In some cases, it can outperform DCA in long-run studies, but requires more discipline and tracking.
Averaging down has been used for decades by some of the most successful investors and even traders in history. But the reason it worked for them is that they combined it with patience, research, and a long-term horizon. For the average trader or investor, the lesson is simple, which is to only average down when you’ve done your homework and you can afford the wait.
If your analysis is sound and the fundamentals hold, the drops can become opportunities to build profits at a discount. If not, the best strategy might be to cut losses and move on. The market will always offer another chance.
Frequently Asked Questions (FAQs)
1. What is the biggest risk of averaging down?
The biggest risk is getting stuck in a value trap. This happens when you keep buying more into a stock that never recovers. Traders can lose a large portion of their account if they average down without a hard stop-loss. For investors, it can mean tying up capital for years in a dead asset. That’s why risk management and having an exit plan are non-negotiable.
2. What types of assets are best for averaging down?
Averaging down is most commonly applied to blue-chip stocks, ETFs, and cryptocurrencies, such as Bitcoin and Ethereum. It works best in assets that have strong fundamentals, high liquidity, and a realistic chance of recovery. You should avoid using it in penny stocks, speculative assets with weak business models, or illiquid assets where price recovery is doubtful after a big fall.
3. Can averaging down be used in a bear market?
Using this strategy in a bear market can be quite risky. While some people see it as an opportunity to buy stocks at low prices, a lengthy downrun can lead to deeper losses. It is only suitable for those with a long investment horizon and a high confidence that the stocks they’re buying are fundamentally strong and will eventually recover.
4. How many times should I average down in a single trade?
While there’s no universal answer for this, many disciplined traders stick to adding 2 to 3 more entries at specific levels they’ve decided on ahead of time. This technique helps you lower your average entry price without risking too much of your capital. But if you go beyond that, you could face the risk of overexposure and bigger losses. It’s really important to plan those entries ahead of time, using technical levels or support zones, instead of making decisions based on emotions. Keeping a set number of entries helps maintain structure, discipline, and better control over risk.
5. How long should I wait for a stock to recover after averaging down?
There is no set timeline. It could be weeks, months, or even years. The timeframe for recovery should be part of your initial analysis of the setup. If you’re a long-term investor, you can afford to be patient. For traders, this period is determined by your technical analysis with indicators and pre-defined exit points.
Zeiierman
With over 16 years in the market, Zeiierman has extensive experience as a full-time trader and risk advisory consultant for hedge funds. He has developed many profitable trading strategies, drawing on his background in risk management and strategy execution.
More from Zeiierman