Works on the Following Platforms
TradingView
For use on the TradingView platform
Institutional FVG with predicted SR levels & Liquidity Range Candle is an indicator that uses Smart Money Concepts to give you the insights needed to make informed decisions based on the theory in SMC . This premium toolkit work in any market and timeframe.
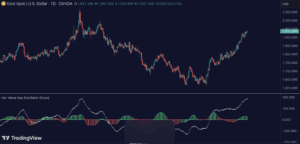
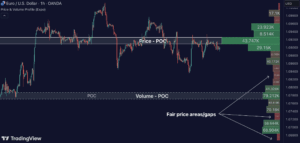
Institutional Fair Value Gap
It is also known as imbalance, inefficiencies, and Liquidity void, identifies the most significant FVG within the lookback period. This is often referred to as Institutional Fair Value Gap since only big players can cause these liquidity voids.
Fair Value Gap, Liquidity voids
These are sudden price changes without enough liquidity at a stable price, and the price jumps from the originating price level to the final price level, creating an imbalance in price.
The price tends to fill or retest the FVG area, and traders understand at which price level institutional players have been active. FVG is a valuable concept in trading, as they provide insights about where many orders were injected, creating this inefficiency in the market. The price tends to restore the balance.
This indicator highlights the most significant Fair Value Gap on the chart and plots predicted future support and resistance levels based on the price action created at the FVG. A super simple and yet effective way to get solid market levels that acts as a magnet for the price.
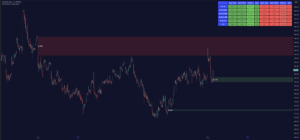
Liquidity Range Candle
It is another trading concept used by large market players where they manipulate the price to stay inside a specific market area, creating a tight consolidation zone. Once the price breaks the liquidity range, liquidity flows into the market. It’s an easy way to grab liquidity from retail traders. Stop losses are triggers, breakout traders jump into the market, and institutional traders absorb the liquidity.
If you don’t see the liquidity, you become the liquidity!
A break of a liquidity range is a sign of a breakout, potential continuation, retracement, or reversal. Use it together with an overall market analysis. It’s common that traders also mark the previous 1-3 liquidity ranges and plot them into the future. These zones can act as a future magnet for the price, and we can get a retest of the zones, or if we break above/below a previous range can be a sign of a trend change. We also know that these liquidity ranges have been important levels for institutional players, who may be willing to accumulate or distribute more orders at these levels.
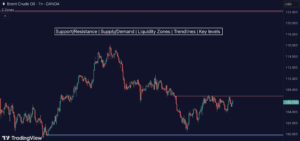
HOW TO USE
Use the indicator to identify several important and commonly used trading concepts taught within the SMC .
- Find Significant FVG
- Find Significant liquidity ranges
Zeiierman
With over 16 years in the market, Zeiierman has extensive experience as a full-time trader and risk advisory consultant for hedge funds. He has developed many profitable trading strategies, drawing on his background in risk management and strategy execution.
More from Zeiierman