Works on the Following Platforms
TradingView
For use on the TradingView platform
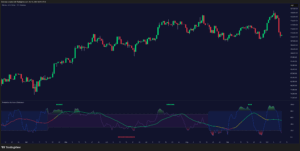
Geometric Pattern (Zeiierman) is a time-independent price-action indicator that visualizes “Price Blocks” and a companion Price Block Oscillator to highlight meaningful shifts in market structure. It focuses on price-driven events rather than elapsed time, helping traders spot trend transitions, structural breaks, pullbacks, and potential exhaustion in strong or extreme trends.
1. What Is Price Structure?
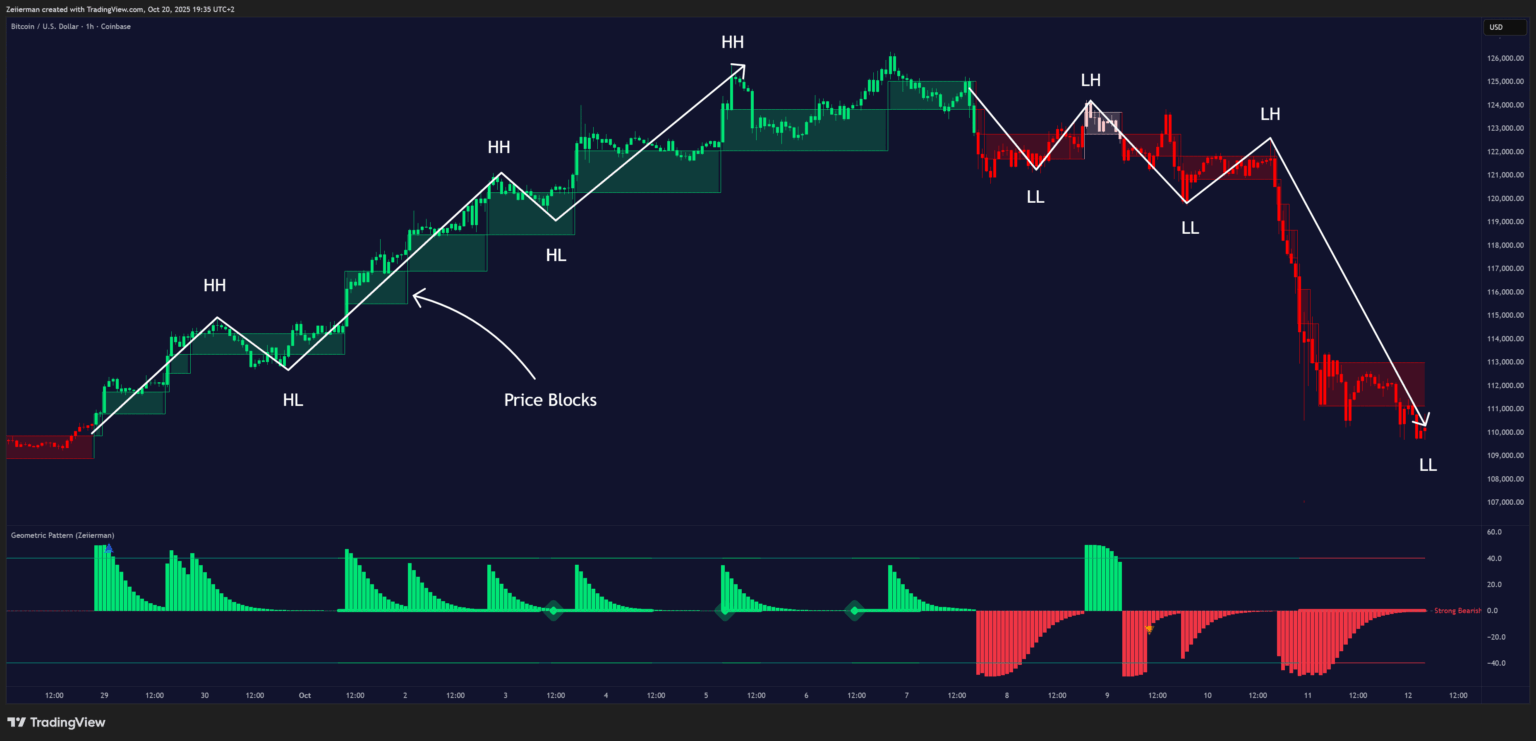
Price structure is the sequence of higher highs/lows and lower highs/lows formed as markets expand and contract. By mapping structure into “Price Blocks” and an oscillator that only reacts to specific price events, this indicator reveals changes in control between buyers and sellers without relying on time-based bars.
2. How to Trade with Geometric Pattern (Zeiierman)
A. Understand Current Price Structure
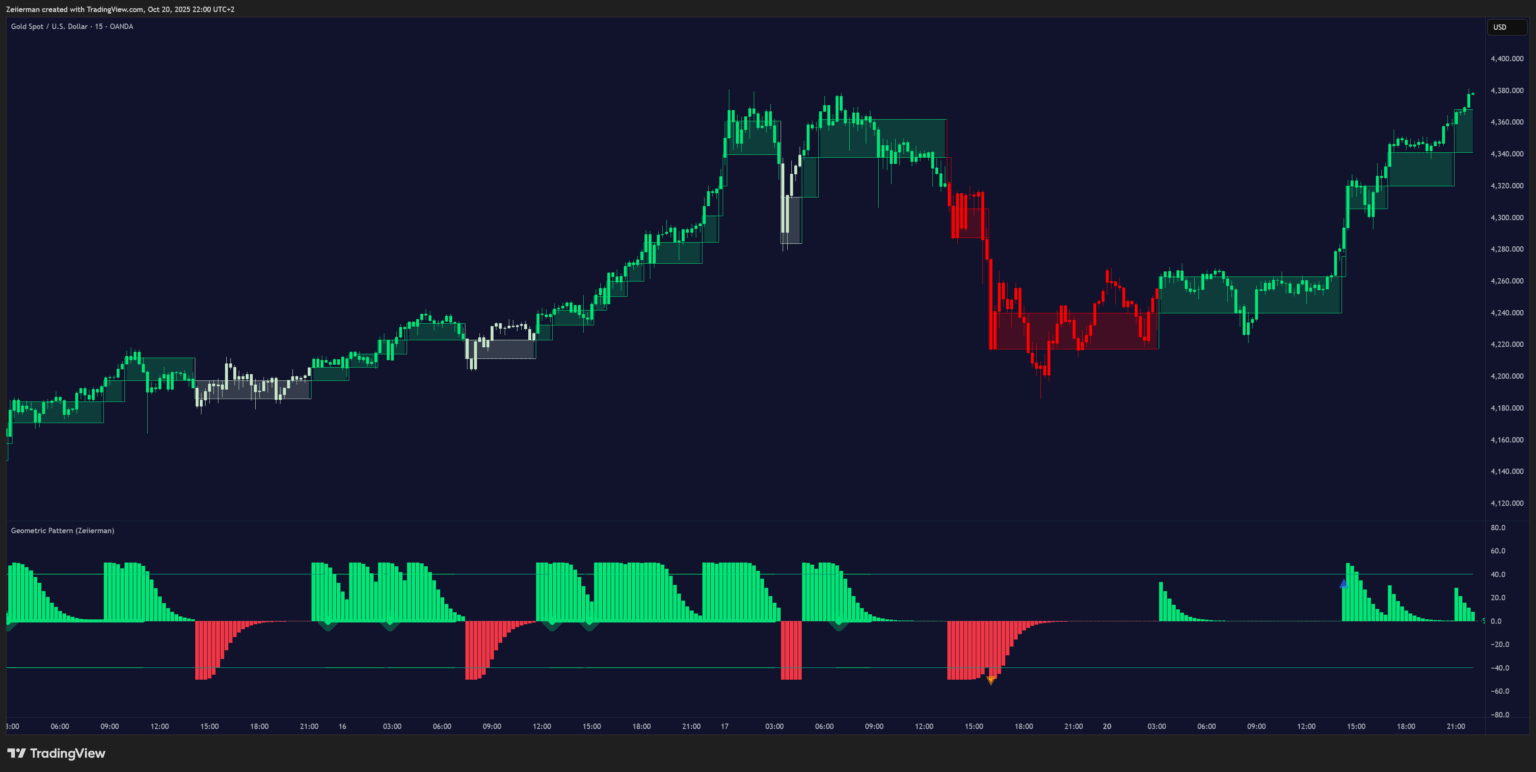
Before trading any move, understand how the current price structure is behaving. The Geometric Pattern (Zeiierman) visualizes structure through Price Blocks and the Price Block Oscillator, which together show how price is flowing and when it’s changing direction.
Each time both the oscillator and the Price Blocks push in the same direction, it indicates that market structure and price flow are aligned, confirming the dominant bias.
B. Breakouts
Strong Bullish Structure Breakout
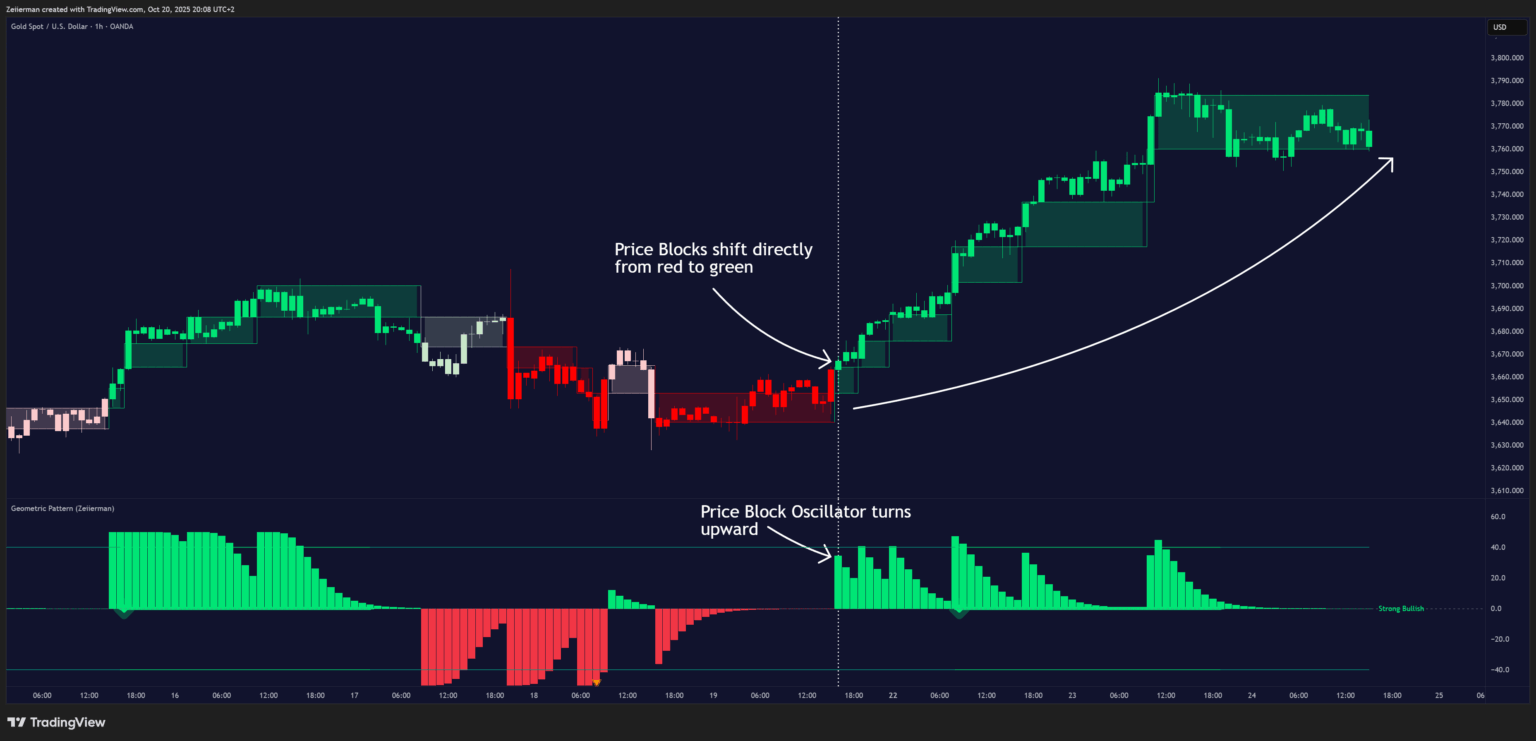
A strong bullish structural breakout occurs when the Price Blocks shift directly from red to green without passing through the weaker bearish phase (light red). When this direct color transition happens at the same time as the Price Block Oscillator turns upward, it confirms a strong structural shift from bearish to bullish momentum.
Strong Bearish Structure Breakout
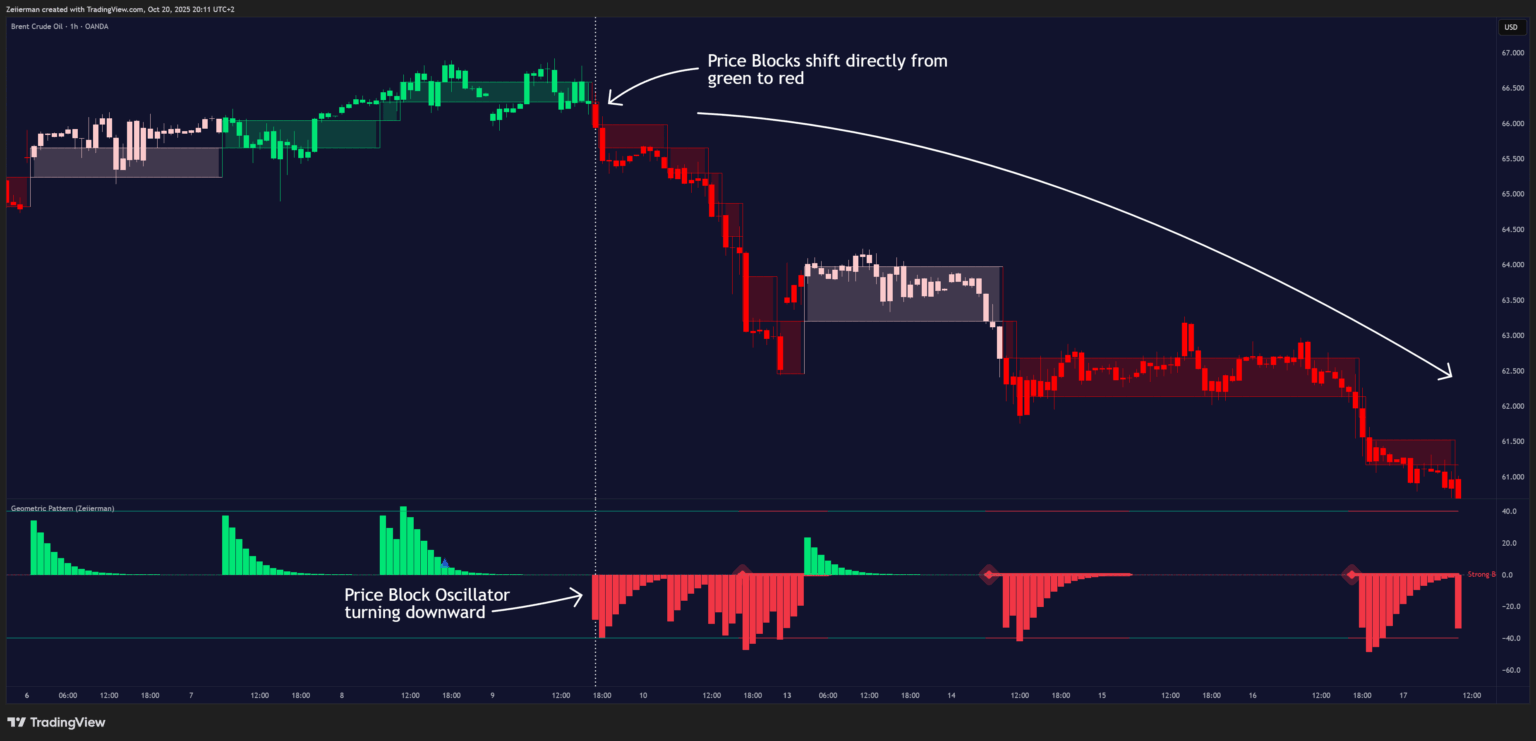
A strong bearish structural breakout occurs when the Price Blocks shift directly from green to red without passing through the weaker bullish phase (light green). When this transition aligns with the Price Block Oscillator turning downward, it signals a strong structural reversal from bullish to bearish conditions.
C. Trend Transition Phases
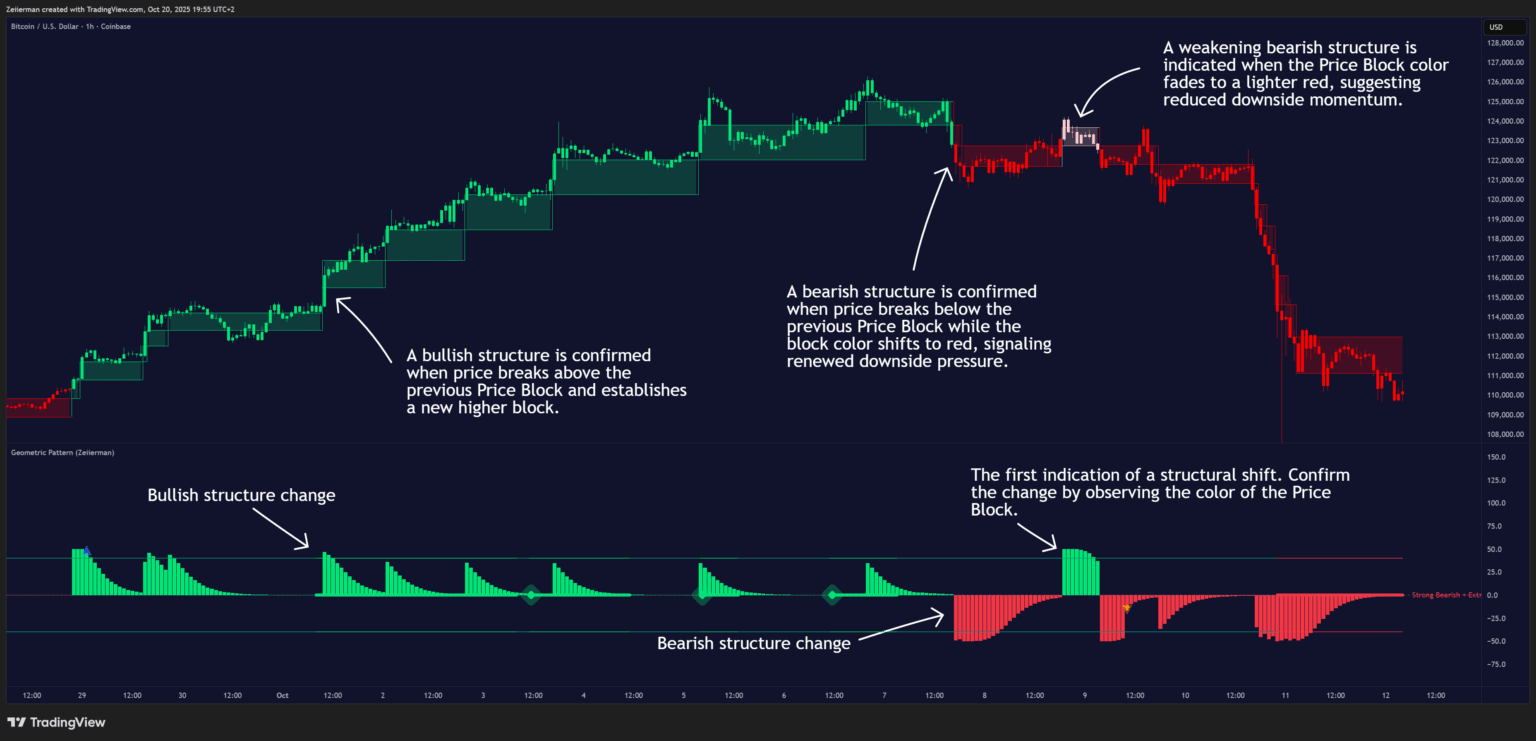
Trend transitions often begin within weaker structural areas, identified by the lighter shades of the Price Blocks. These lighter zones represent a loss of momentum in the prevailing direction, as buyers or sellers begin to lose control.
When the market shifts from a strong color (deep green or deep red) to a lighter tone, it signals that the current structure is weakening and a potential change in direction may be developing. During this phase, the Price Block Oscillator typically moves toward its mid-zone, showing reduced conviction in the current trend.
A confirmed trend transition occurs once the lighter-colored blocks give way to a new strong color in the opposite direction, accompanied by the oscillator flipping across its midline. The first clean sequence of strong-colored blocks following this shift marks the emergence of a new structural leg, the start of a fresh directional move.
D. Pullback Entries
Bullish Pullback
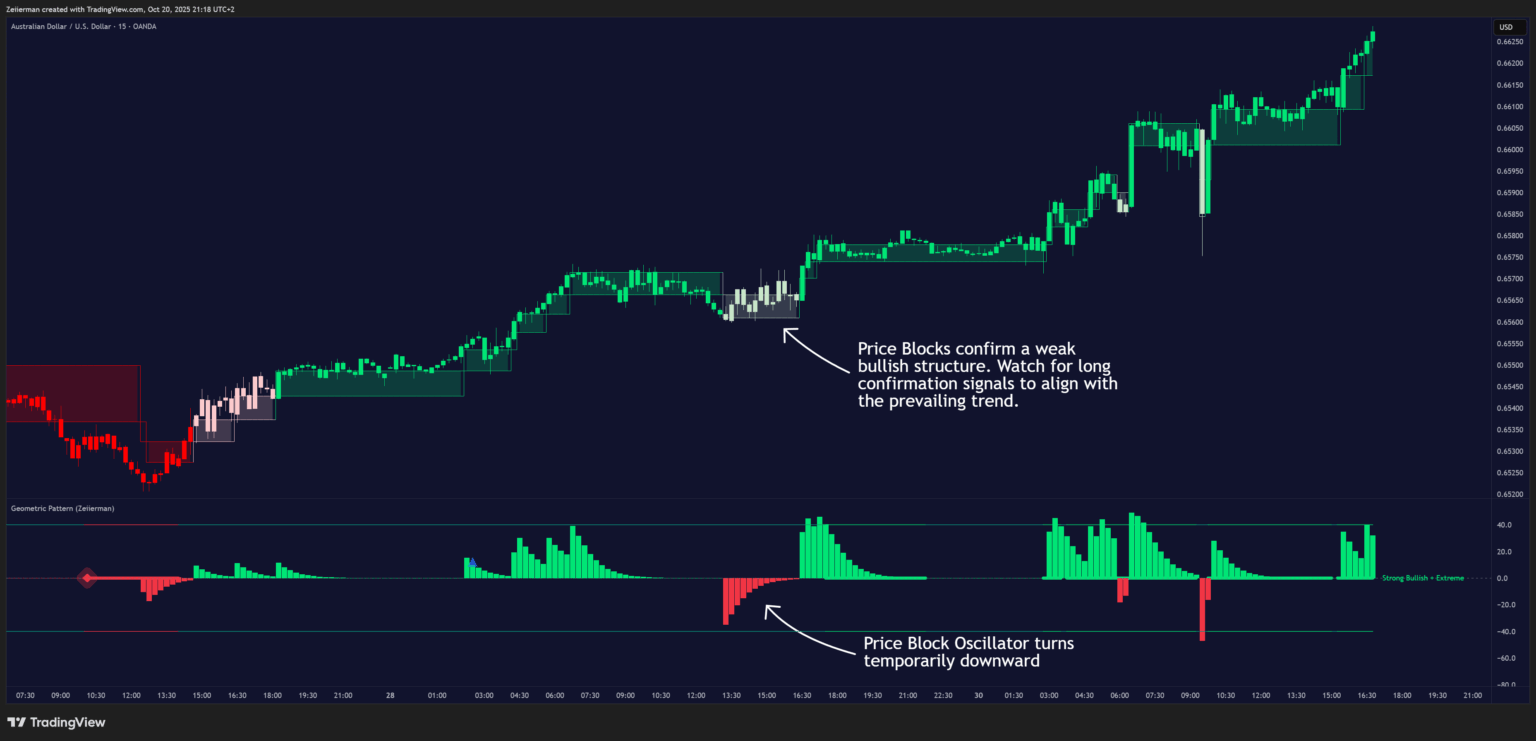
A bullish pullback occurs when the Price Blocks confirm a weak bullish structure (lighter green) while the Price Block Oscillator turns temporarily downward (red). This suggests a brief pause or correction within an ongoing uptrend. When the oscillator re-engages upward and the blocks shift back to strong green, it signals that bullish momentum is resuming, providing potential entry points in line with the prevailing trend.
Bearish Pullback
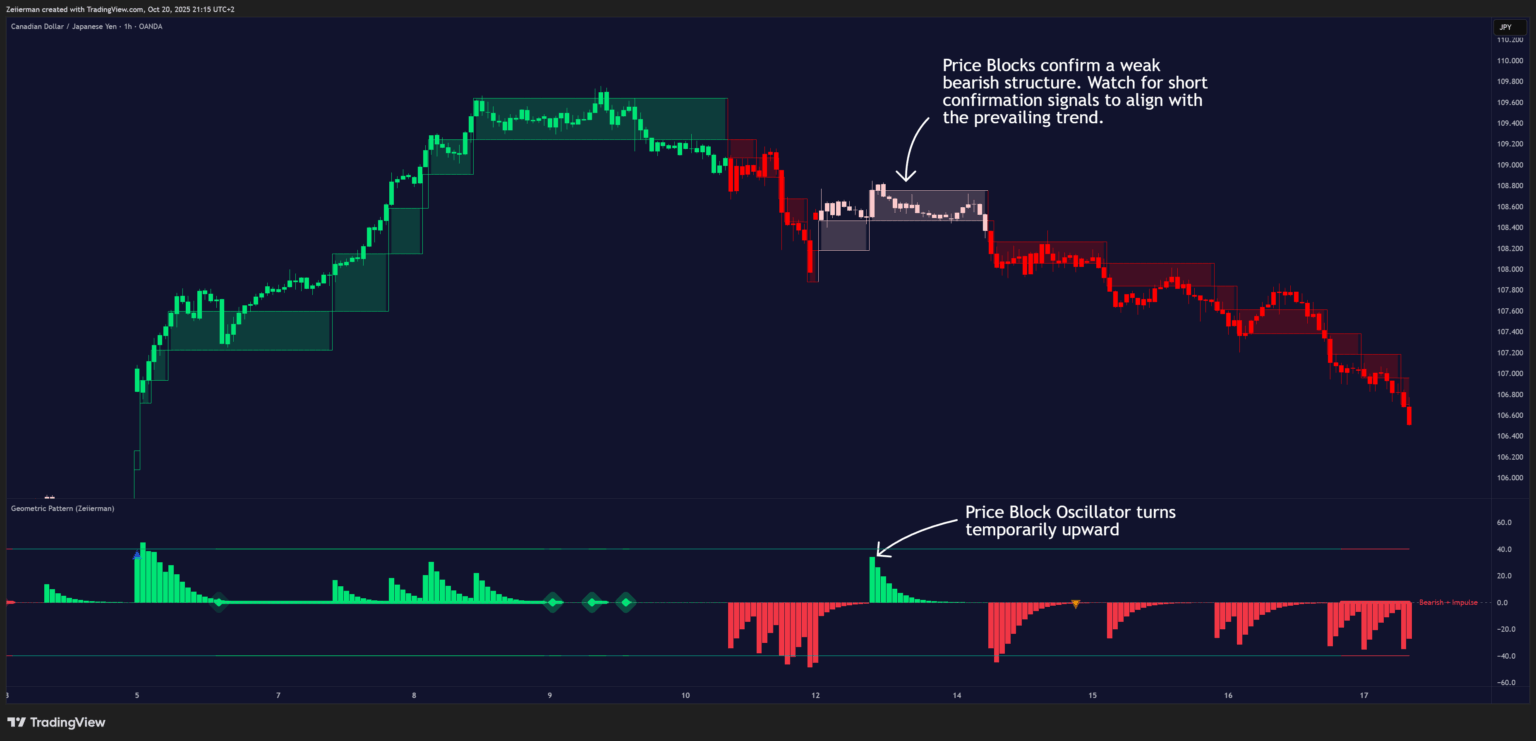
A bearish pullback is identified when the Price Blocks confirm a weak bearish structure (lighter red) while the Price Block Oscillator turns temporarily upward (green). This indicates a short-term weakening in bearish momentum, a corrective move against the prevailing downtrend. Such pullbacks can offer opportunities to enter short positions in anticipation that the overall bearish structure will resume once the oscillator turns back down and the blocks return to strong red.
E. Strong Trend & Extreme Modes (Exhaustion Risk)
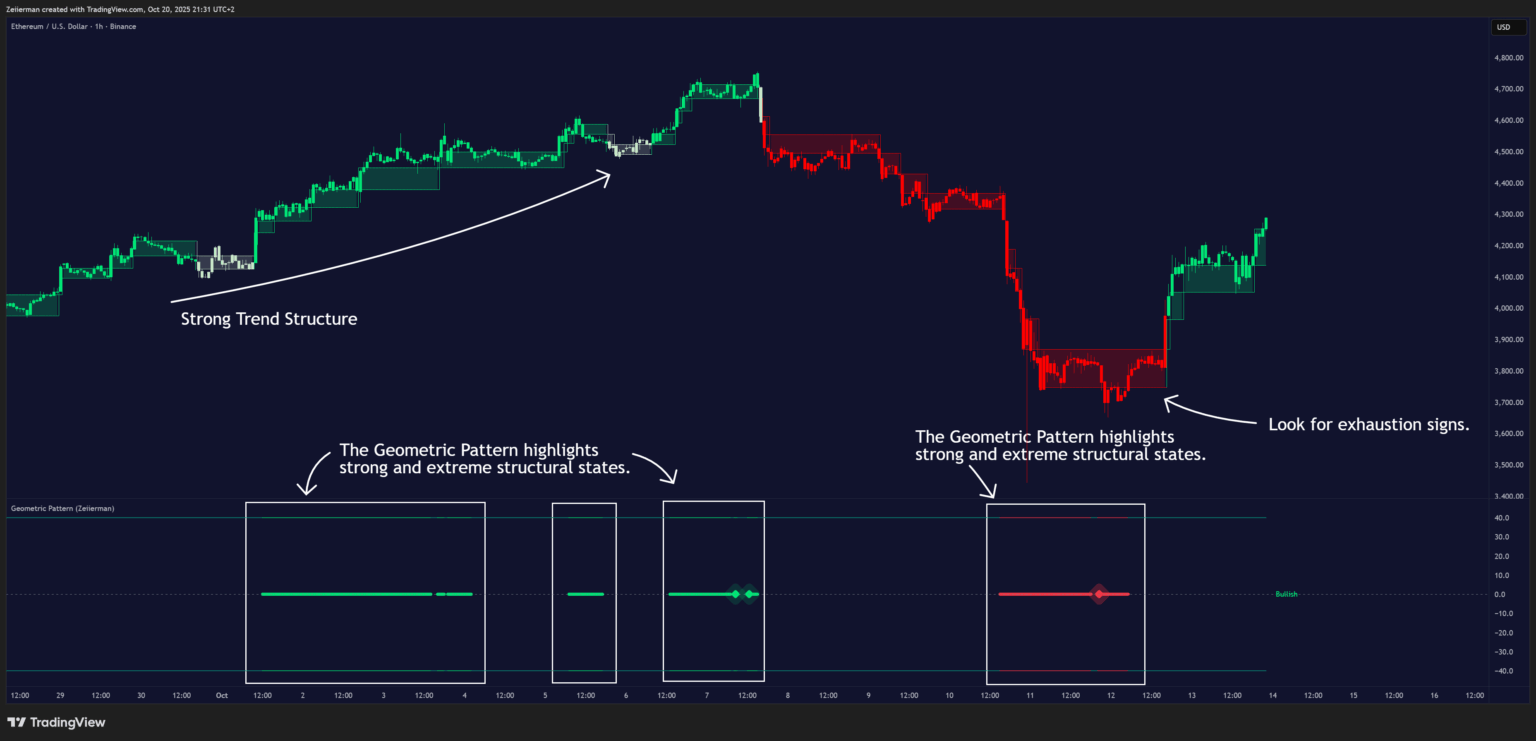
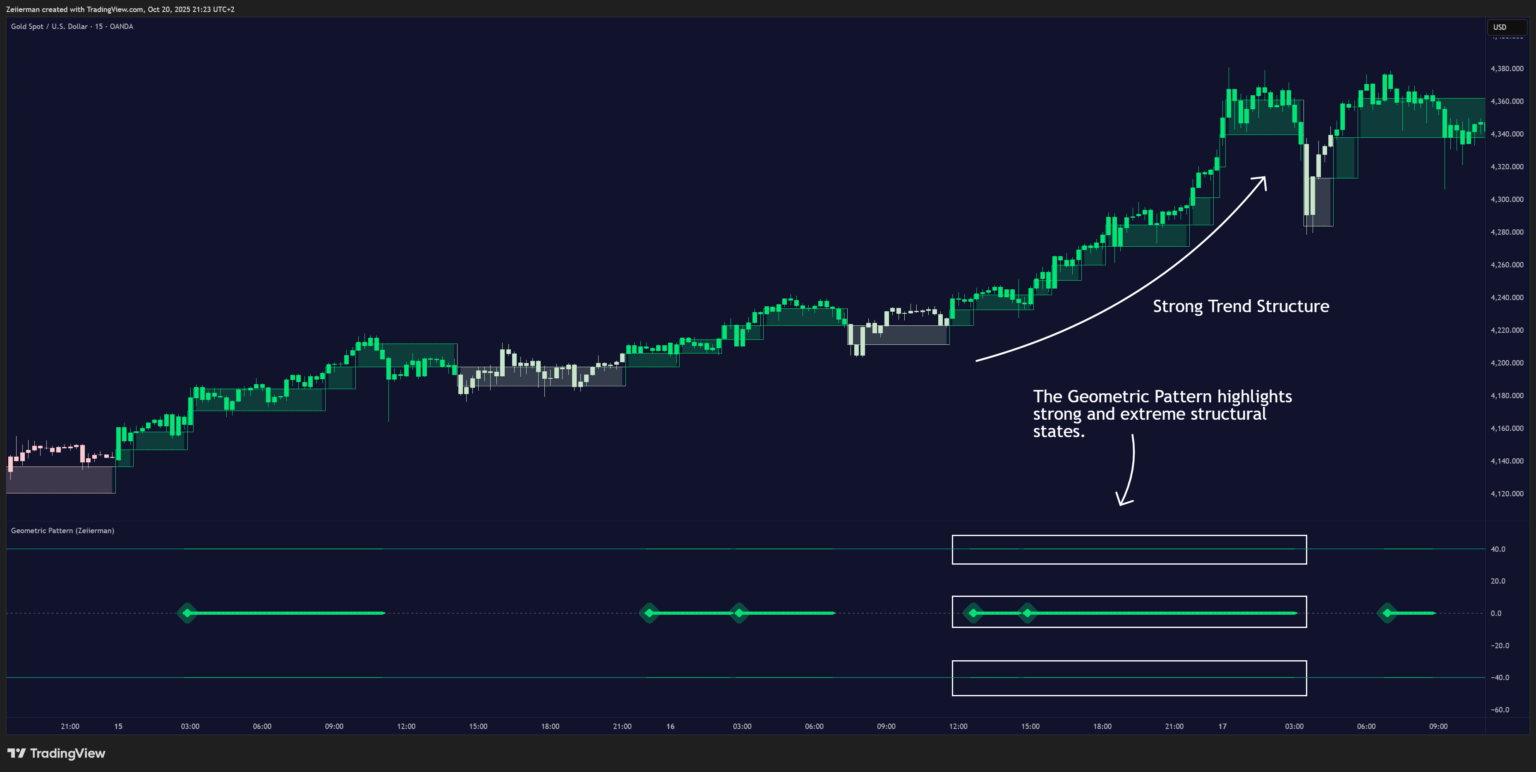
The Geometric Pattern highlights strong and extreme structural states. When these align with the prevailing block regime, continuation is favored and breakouts tend to travel farther. When extreme mode appears into prior structure or after an extended run, monitor for exhaustion: slowing block progression, or a color softening followed by an oscillator stall are common early tells.
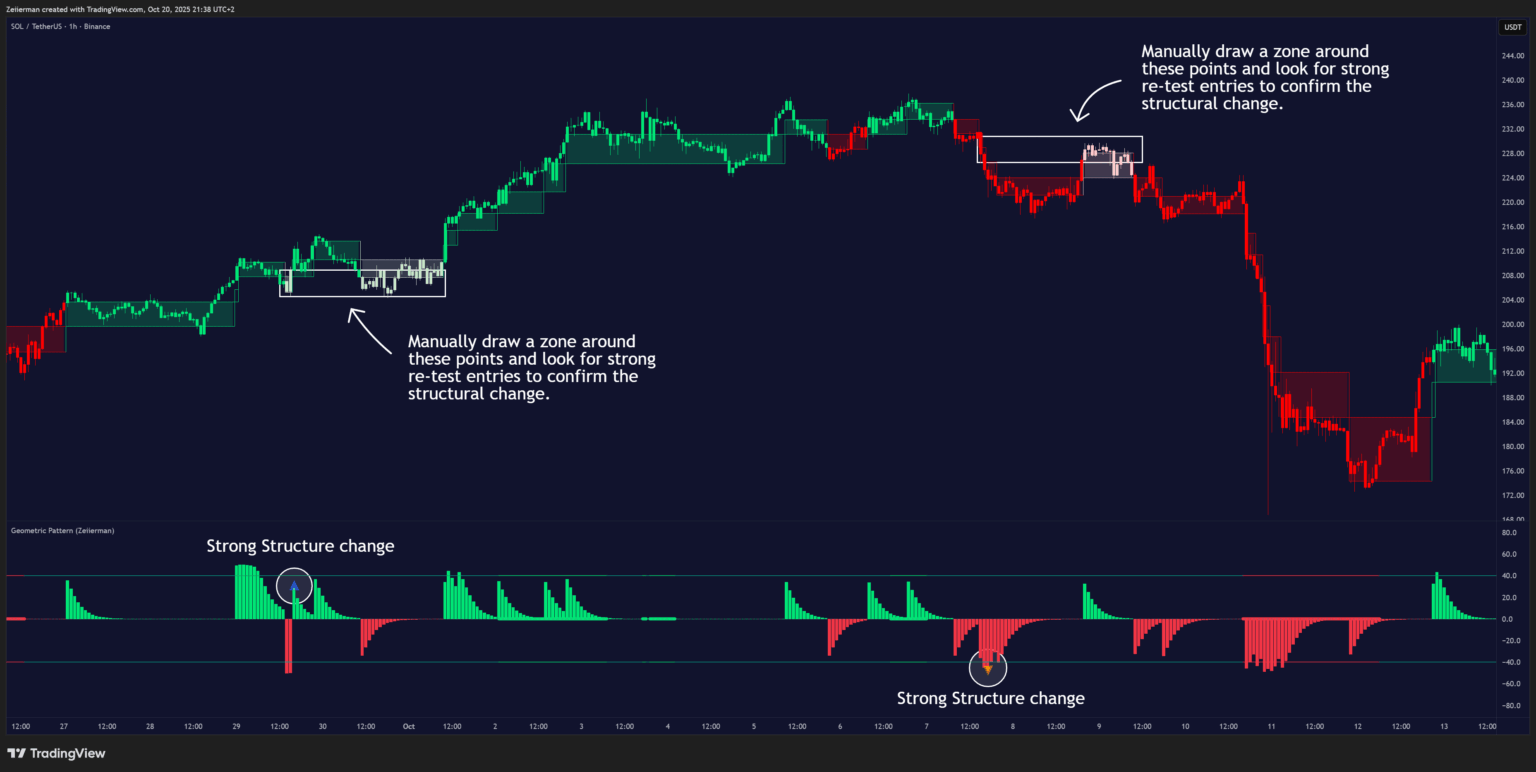
F. Strong Structure Change
This feature highlights major structural changes that have the potential to set the tone for a new long-term market structure.
- When a blue triangle appears, it indicates that a long-term structural point has been detected where the structure flow is shifting from bearish to bullish.
- When an orange triangle appears, it signals that a long-term structural point has been detected where the structure flow is shifting from bullish to bearish.
Use these signals as an early indication that the future market structure may be in transition. The shift does not always occur immediately, it is often a gradual process that begins at these key turning points.
When these points appear, manually mark a zone around them and monitor for re-tests. A successful re-test often provides confirmation of the structural change and offers high-probability entry opportunities.
3. Simple Strategy: Geometric Pattern (Zeiierman)
Goal: This strategy identifies high-probability price structure breakouts. Breakout trading can be highly rewarding when the breakout is real, though it naturally has a lower win rate but higher risk-reward.
Fakeouts and shakeouts often mislead traders. This strategy aims to filter those out by focusing on breakouts that align with clear structural shifts — improving accuracy while maintaining strong reward potential.
Settings: Enable candle coloring to clearly visualize the trend direction on the chart.
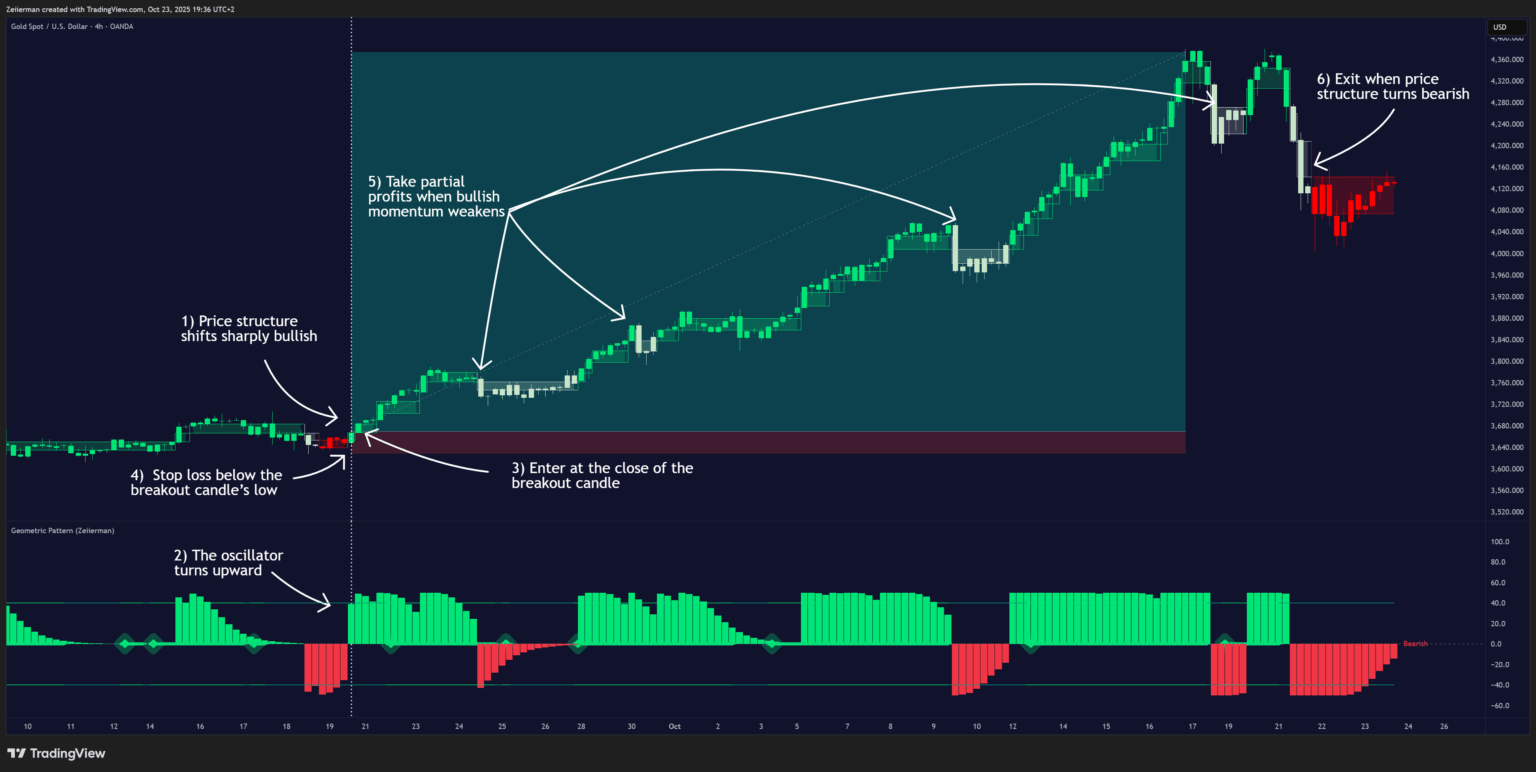
A. Long Setup (Bullish Scenario)
Trigger: A new bullish price block forms with a strong green breakout candle and no weak zone in between. At the same time, the Price Block Oscillator shifts upward — confirming a bullish structural breakout.
Entry: Enter at the close of the breakout candle.
Stop Loss: Below the breakout candle’s low.
Take Profit: Take partials when momentum weakens.
Full Exit: Exit when price structure turns bearish (red blocks and candles).
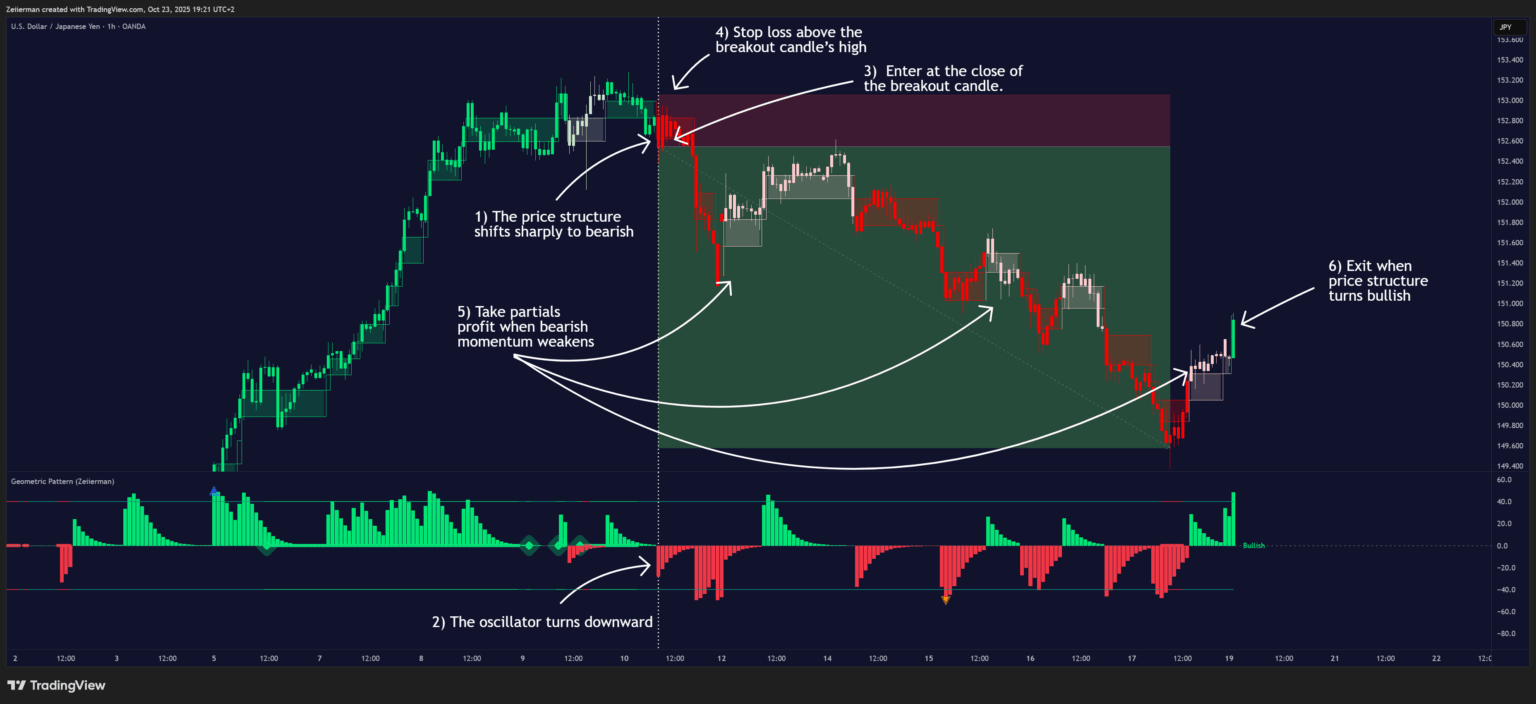
B. Bearish Setup (Short Scenario)
Trigger: A new bearish price block forms with a strong red breakout candle and no weak zone in between. Simultaneously, the Price Block Oscillator shifts downward — confirming a bearish structural breakout.
Entry: Enter at the close of the breakout candle.
Stop Loss: Above the breakout candle’s high.
Take Profit: Take partials when bearish momentum weakens.
Full Exit: Exit when price structure turns bullish (green blocks and candles).
4. Settings Explained
Price Block
Block dynamic: Controls how adaptive the Price Blocks are. Lower values create more fixed-size blocks; higher values let blocks expand/contract with price volatility so structure remains readable across instruments and timeframes.
Trend (bars): Sets how long each block’s impulse influences the Price Block Oscillator. Shorter values fade faster and react quickly; longer values preserve pushes so trends appear “stickier.”
Significant Structure: Creates a small neutral zone around the oscillator’s midline to filter micro-fluctuations. Increase to suppress minor noise and focus on meaningful structure changes.
Block Lines Shows the two Price Block boundaries on chart. Keep enabled for a clear read of structure and transitions.
Block Fill: Fills the space between block boundaries to make the prevailing side stand out visually.
Candle Fill: Applies block color directly to candles so bar-by-bar action aligns with the active Price Block regime.
Colors: Strong/Weak Trend: Customize strong and weak shades for up and down states. Use stronger tones to denote decisive control and softer tones for early or tentative phases.
Strong Structure Change
Strong Structure Change: Toggles markers when notable structural shifts occur. These help you spot points where control may have flipped.
Marker Colors: Choose distinct colors for bullish and bearish structure-change markers to speed up visual recognition.
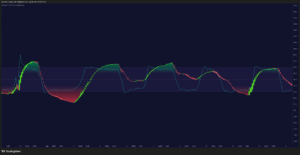
Geometric Strength
GeoPattern: Shows the base Geometric Pattern line that maps geometric properties of price movement to highlight structural context.
Strong GeoPattern: Emphasizes stronger detections from the Geometric Pattern. Useful for confirmation before breakouts or to validate trend continuation.
Pattern Strength: Lookback that governs how much historical structure informs the Geometric Pattern. Higher values prioritize larger structural swings; lower values reveal shorter-term patterns.
Sensitivity: Controls how readily the Geometric Pattern responds to new information. Lower values reveal more events; higher values filter for fewer, more prominent events.
Colors & Line Thickness: Set bullish/bearish colors and thickness for the Geometric Pattern line to match your chart style and visibility preferences.
Alerts & Price Block Colors
Alert Line: Displays your alert thresholds directly on the oscillator. Use them to standardize triggers for breakouts, momentum continuation, or exhaustion checks.
Alert Threshold: Sets the level the Price Block Oscillator must reach or cross to trigger your chosen alert logic. Calibrate per instrument.
Price Block Colors: Choose up/down colors for the oscillator and block visuals to maintain a consistent read of direction across charts.
Trend Background
Trend Length: Defines the lookback used to infer background trend context (higher highs/lows vs. lower highs/lows). Larger values emphasize the broader swing; smaller values react to short rotations.
ShortTerm Trend / Strong Trend: Optionally shade the background to denote short-term transitions (HL/LH) or more forceful conditions (HH/LL). These overlays provide instant context behind the blocks and oscillator.
Background Colors: Pick separate tones for positive/negative background states so you can distinguish quick shifts from dominant trends at a glance.
Show Guidance: Displays concise on-chart text such as “Bullish,” “Bearish + Impulse,” “Strong Bullish + Extreme” to summarize the current state. Useful for quick decisions without reading multiple components.
Quick Tuning Tips
These guidelines help you adjust parameters to fit your trading style or market conditions.
1. Scalping / Fast Markets
If you trade short-term moves or fast timeframes:
- Reduce Trend (bars) to make the oscillator react instantly to price shifts.
- Lower Significant Structure to catch smaller structural impulses earlier.
- Increase Block Dynamic slightly to let blocks adapt faster to volatility.
Result: A highly responsive setup that captures rapid changes in price structure — ideal for scalpers or short-term traders, but expect more frequent signals.
2. Swing / Trend Following
If you focus on longer, more sustained moves:
- Increase Trend (bars) to smooth out noise and emphasize primary structure.
- Increase Pattern Strength to capture the larger structural context.
- Lower Block Dynamic to keep block sizes stable during extended trends.
Result: A smoother, slower response that filters short-term noise — ideal for swing or position trading and identifying the major structural flow.
3. Reducing Noise / Choppy Markets
If markets are ranging or irregular:
- Increase Significant Structure to ignore minor fluctuations.
- Increase Trend (bars) to make the oscillator more selective.
- Lower Block Dynamic to reduce over-sensitivity to small price movements.
Result: A calmer and cleaner chart that avoids false signals and focuses on meaningful structure transitions.
5. Frequently Asked Questions (FAQs)
Q1: What makes this indicator time-independent?
It reacts to specific price-driven events (Price Blocks and their oscillator impulses) rather than the passage of time, so the same structural logic applies across all chart timeframes.
Q2: How do Price Blocks help with breakouts?
Blocks visualize where price is consolidating versus expanding. When new blocks form beyond recent structure while the oscillator pushes through your alert line, the breakout becomes easier to confirm and act on.
Q3: Can this help me find pullback entries?
Yes. A pullback is often seen when the Price Block Oscillator temporarily moves against the prevailing trend while the Price Blocks shift to a weaker shade (light red or light green). This shows a short-term correction within the dominant structure. When the oscillator re-engages in the original direction and a new strong-colored block appears, it confirms that the trend is resuming and provides a clean pullback entry opportunity.
Q4: What is the Geometric Pattern used for here?
It highlights strong and extreme structural conditions in the market. These modes are useful for confirming trend continuation and for spotting potential exhaustion when extremes appear into prior structure.
Q5: Does it replace other confirmation tools?
It can stand alone, but many traders use it alongside their own levels or execution rules. The goal is to provide a consistent structural overlay that clarifies trend transitions, breakouts, and exhaustion.
Q6: How should I set the alert levels?
Start with a moderate threshold and then tune per instrument. Higher thresholds reduce noise and focus on decisive pushes; lower thresholds reveal earlier signals suitable for faster trading styles.
Q7: Can I use this on any market or timeframe?
Yes. Because it is price-driven and event-based, it adapts across symbols and timeframes while keeping the same structural meaning.
Q8: What’s the best way to avoid false signals?
Use confluence: align block color, oscillator direction, and the Geometric Pattern’s strong or extreme cues. Avoid trades when these elements conflict near congested structure.
Q9: How do I manage exits with this indicator?
Common exit cues include opposite-color flips in both blocks and oscillator, failure to sustain beyond prior structure, or an extreme condition appearing against your position.
Zeiierman
With over 16 years in the market, Zeiierman has extensive experience as a full-time trader and risk advisory consultant for hedge funds. He has developed many profitable trading strategies, drawing on his background in risk management and strategy execution.
More from Zeiierman
![Trend Analysis [Ultimate]](https://www.zeiierman.com/wp-content/uploads/2025/03/Trend-Analysis-Ultimate-Update-300x151.png)