Works on the Following Platforms
TradingView
For use on the TradingView platform
The Confirmation – Machine Learning indicator by Zeiierman is a dynamic trend and momentum confirmation tool designed to adapt to price volatility to stay consistent with the current market trend. It combines a machine-learning–inspired vector oscillator, a price-adaptive trend line, and early trend confirmation signals to help traders identify high-probability trends and market impulses. The indicator blends trend direction, volatility, and oscillator momentum into one clear visual system.
1. What Is the Confirmation Oscillator?
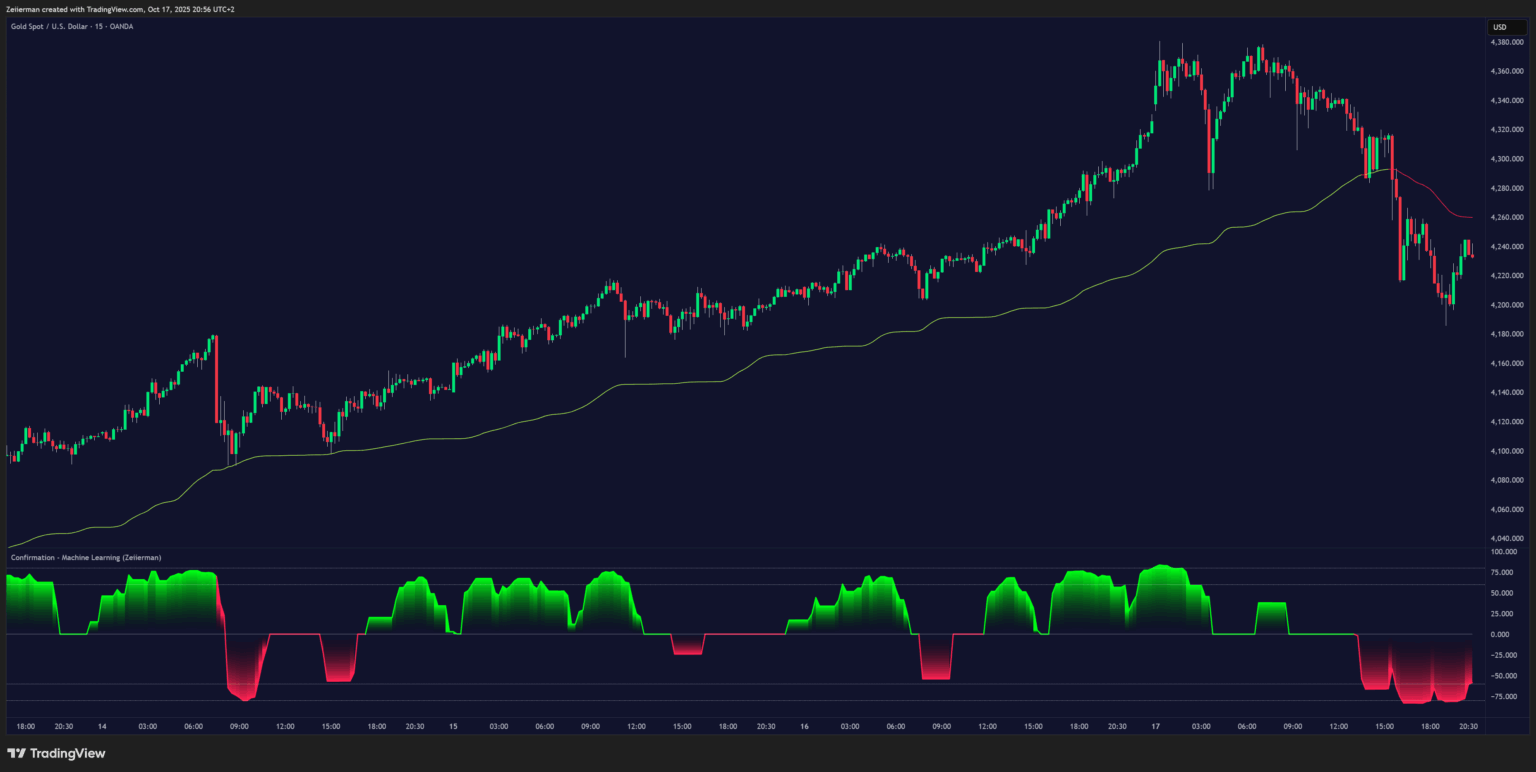
The Confirmation Oscillator measures the directional strength of a price-derived trend line.
It converts subtle shifts in market momentum into an easy-to-read oscillator, helping traders see when the market is trending, accelerating, decelerating, or changing direction.
When the oscillator moves above zero, bullish pressure is increasing. When it drops below zero, bearish pressure strengthens.
2. How to Trade with the Confirmation – Machine Learning Indicator
1. Trend Following
Use the oscillator to confirm the direction of the prevailing trend.
- Bullish trend: Oscillator above 0 and rising (green area).
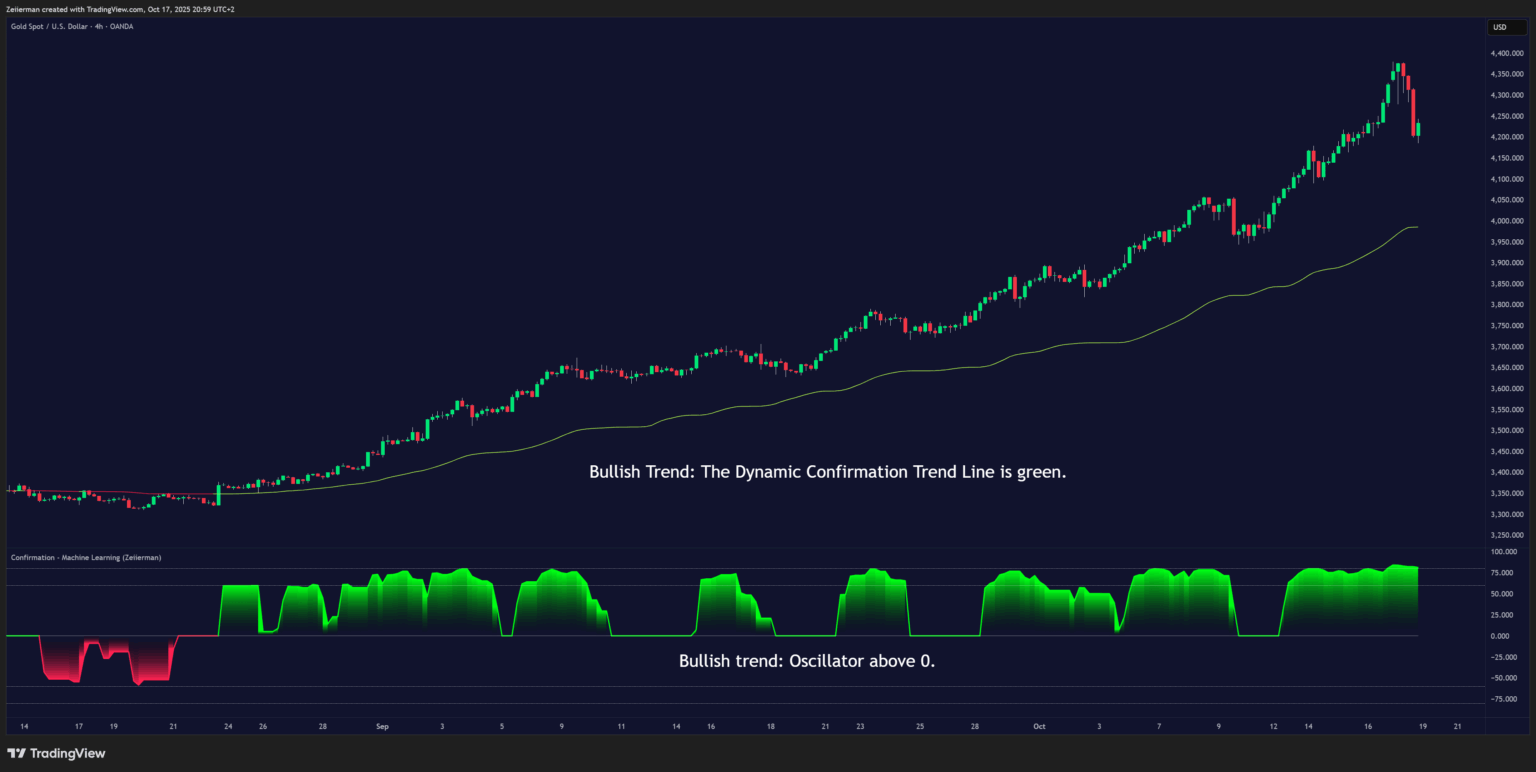
- Bearish trend: Oscillator below 0 and falling (red area).
- The Dynamic Confirmation Trend Line on the chart visually tracks directional bias — when price stays above it, momentum favors the bulls; when below, bears are in control.
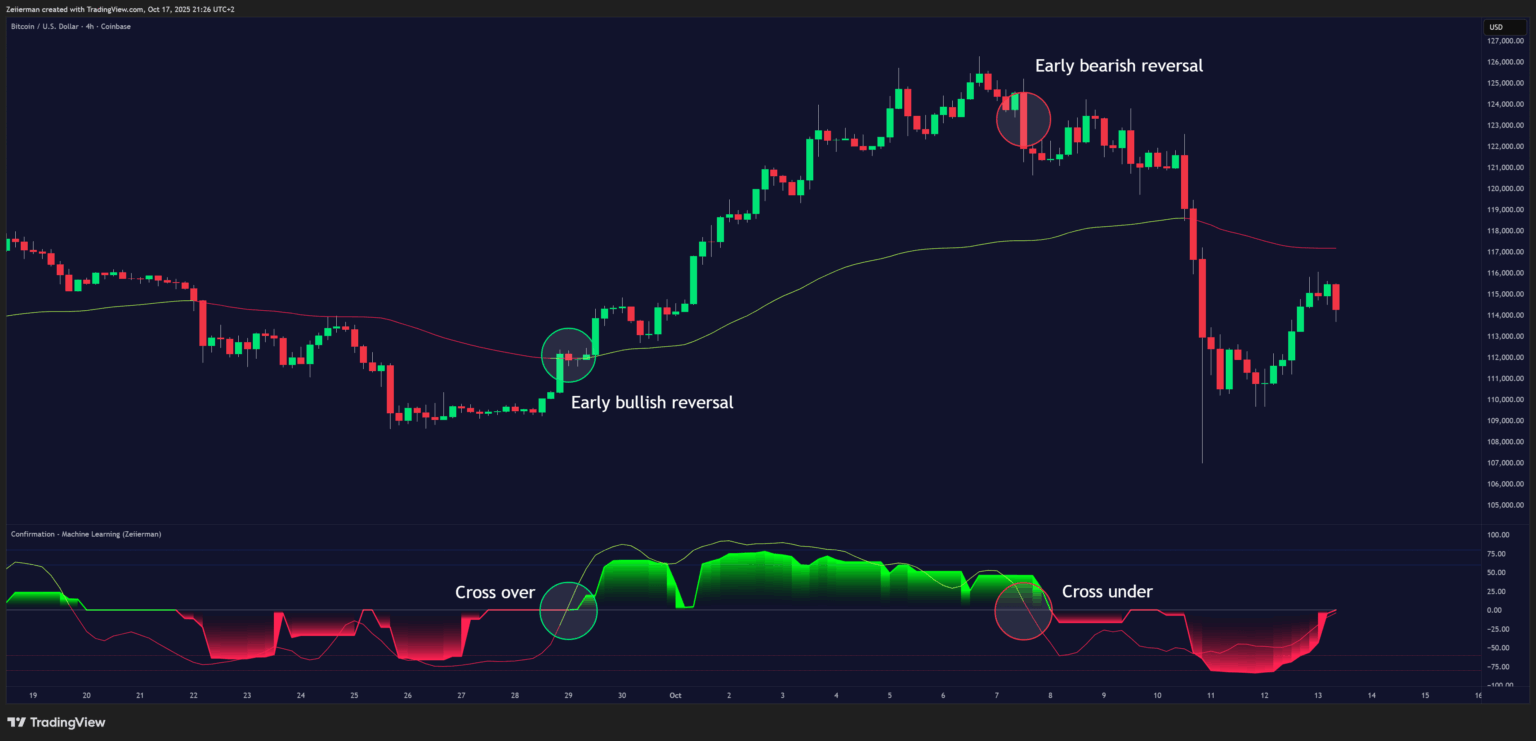
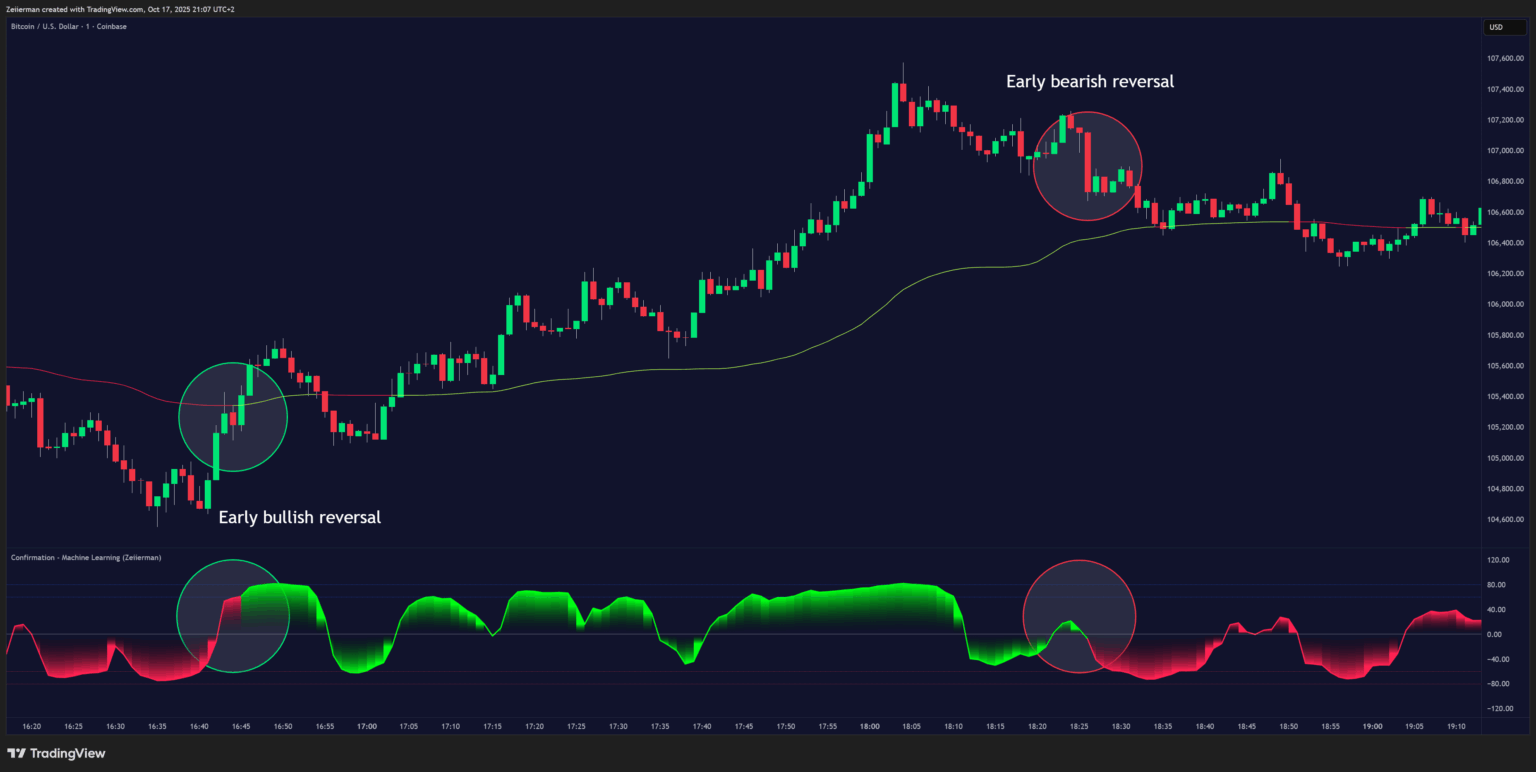
2. Early Reversals
The Early Price Trend Line reacts faster than the main oscillator and gives preliminary reversal hints.
- When this line crosses above zero and changes to the “positive” color, it suggests a potential bullish reversal.
- When it turns negative, it warns of an upcoming bearish rotation before the larger trend confirms.
Using the Early Price Trend
Make sure to enable the setting: “Price Trend” in the indicator’s style options.
This activates the Early Price Trend Line, a faster-moving signal that reacts quickly to changes in momentum.
When enabled, this line helps identify early reversals and momentum shifts before the main oscillator confirms them.
Using the Price Action Aware Mode
Make sure to enable the setting: “Price Action Aware” under the main input settings.
This mode blends recent price movement into the indicator’s calculations, making the oscillator more responsive to sharp price changes — ideal for intraday trading or volatile assets.
When enabled, it provides earlier confirmation of momentum shifts.
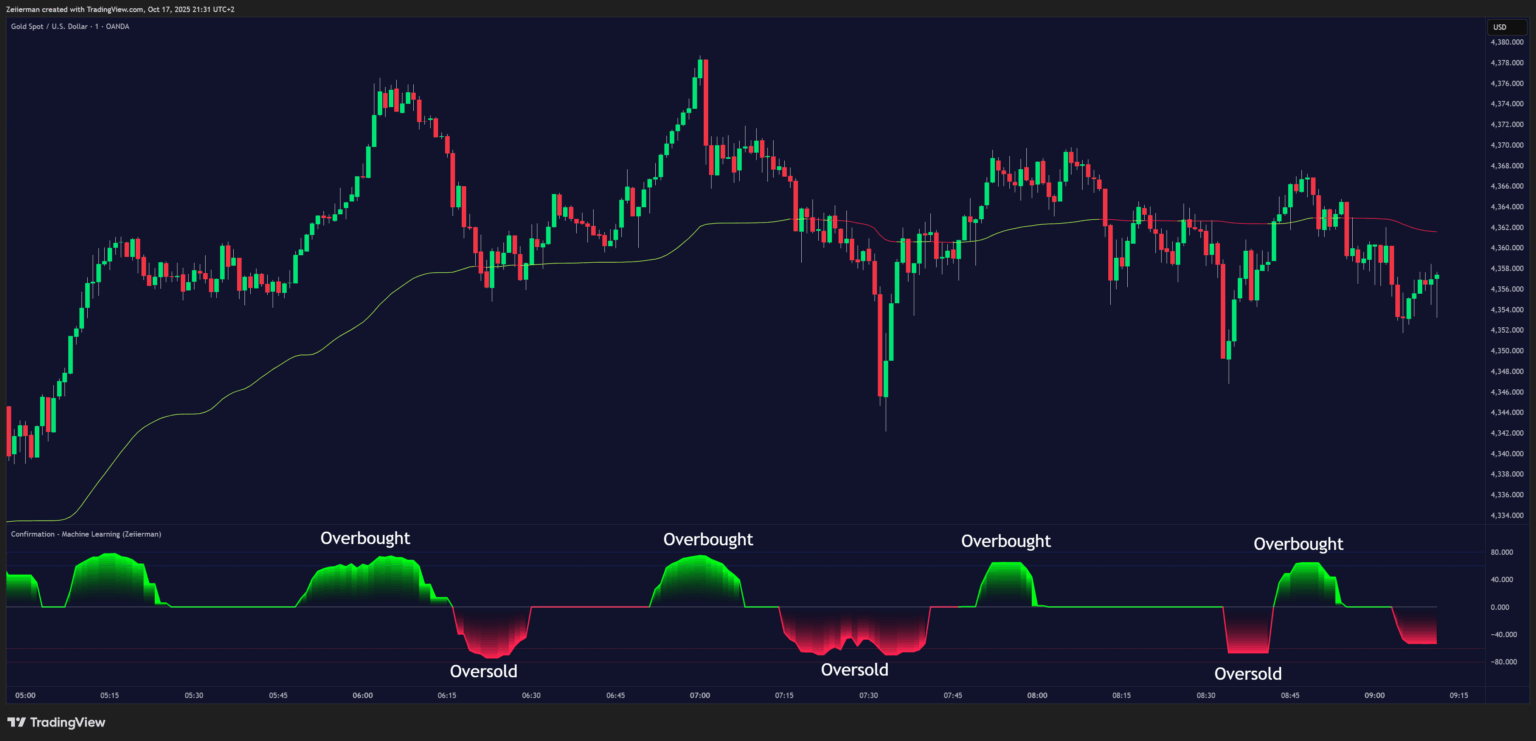
3. Overbought & Oversold Extremes
Horizontal dotted levels (±60 and ±80) act as Overbought (OB) and Oversold (OS) zones.
- Values near +80 may indicate trend exhaustion or strong bullish momentum ripe for correction.
- Values near –80 may signal selling exhaustion or potential bullish rebound areas.
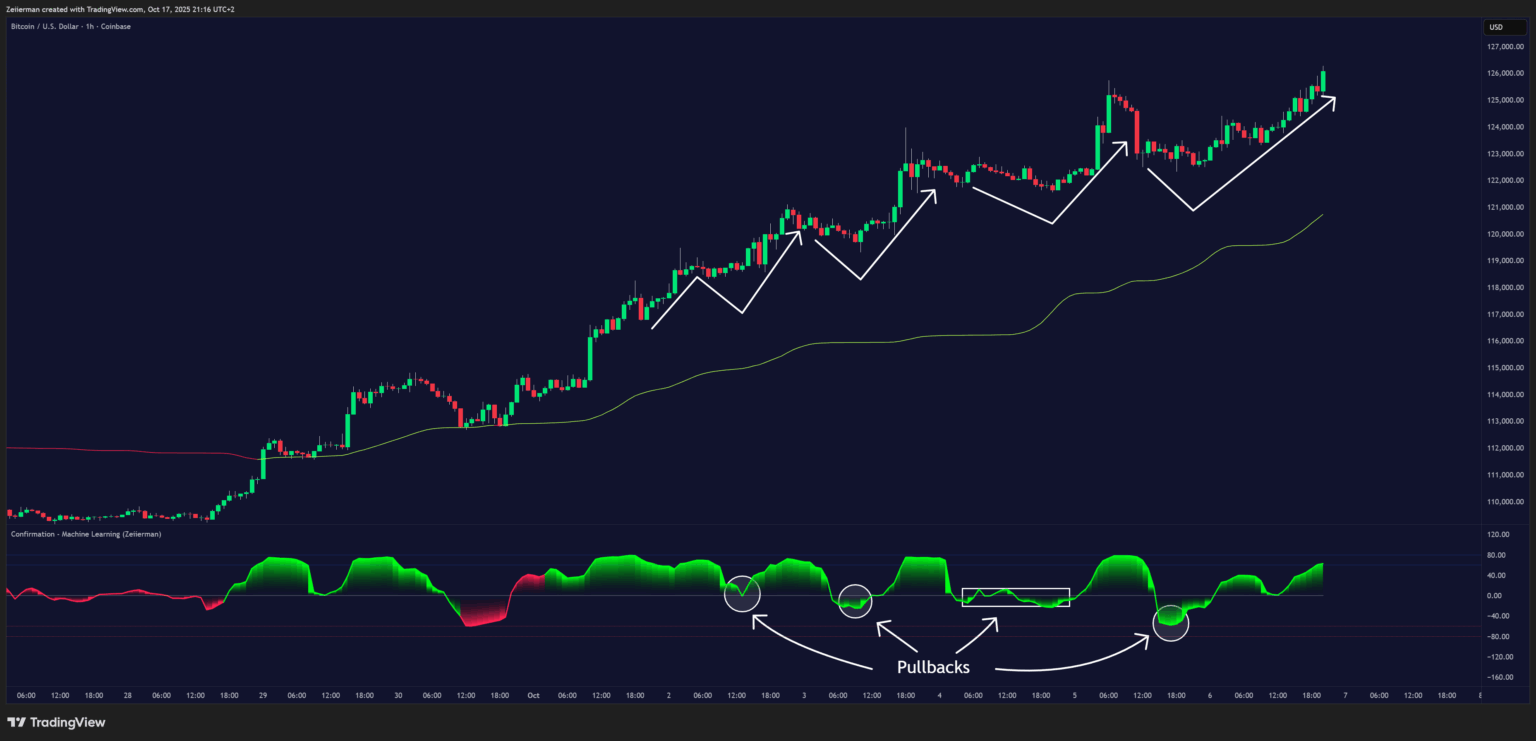
4. Price Action Aware Mode
Enabling Price Action Aware blends recent price behavior into the indicator’s base calculation. This makes the oscillator more responsive to sharp market shifts, which is especially useful for volatile assets or intraday trading.
Traders can use this mode to spot faster pullback entries within an existing trend — allowing earlier positioning during short-term corrections.
Bullish Pullback Setup
- The Confirmation Oscillator remains green (showing bullish momentum).
- The oscillator dips below the midline (0) or into the oversold zone (-80) while staying green.
- The Dynamic Confirmation Trend Line is green, and price remains above it.
Interpretation:
This indicates a temporary pullback within a bullish trend — a potential buying opportunity near the trend line before momentum resumes upward.
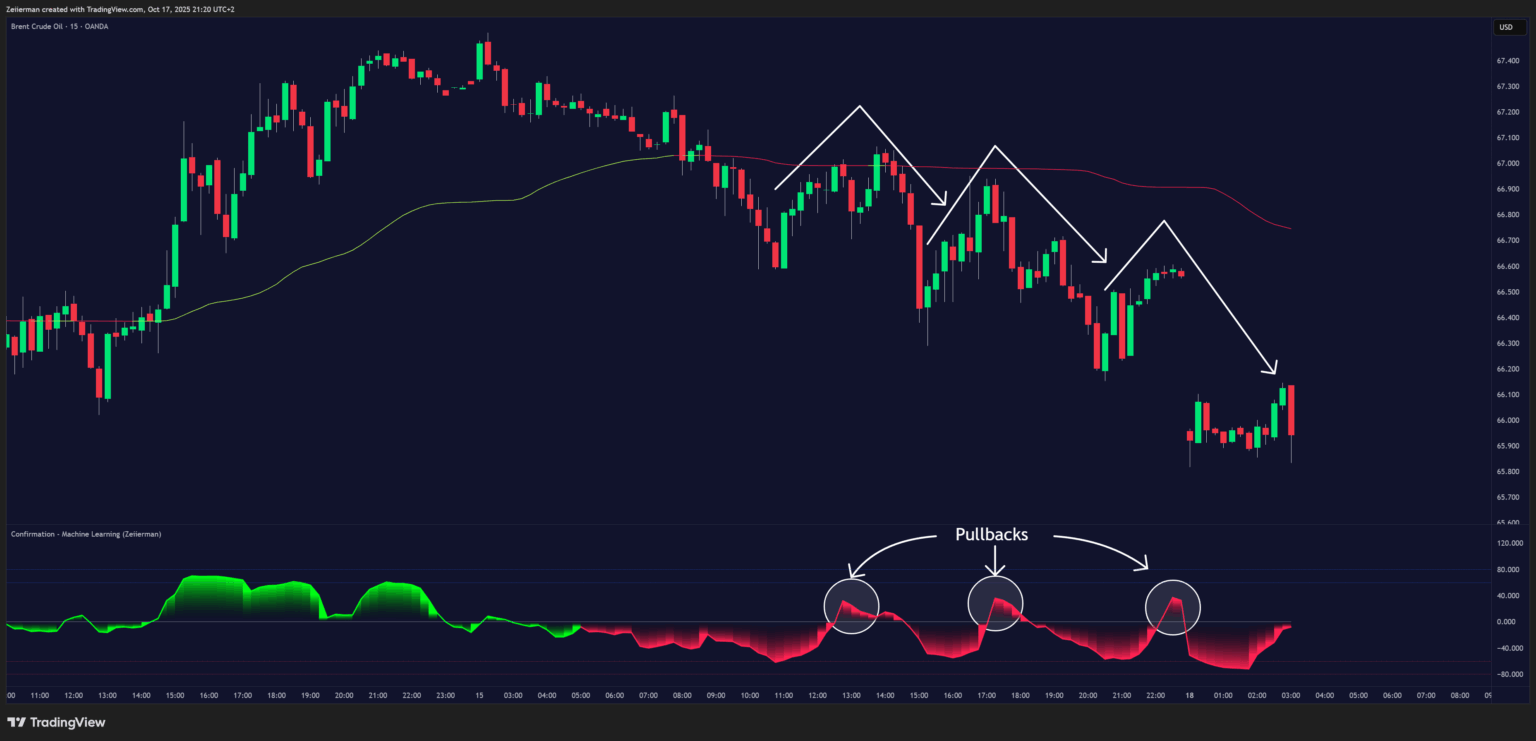
Bearish Pullback Setup
- The Confirmation Oscillator remains red (showing bearish momentum).
- The oscillator rises above the midline (0) or into the overbought zone (+80) while staying red.
- The Dynamic Confirmation Trend Line is red, and price remains below it.
Interpretation:
This signals a temporary bullish retracement within a bearish trend — a potential short opportunity near the trend line before momentum continues downward.
5. Quiet Zones: Accumulation and Distribution
When the main oscillator stays flat near zero, it signals a low-volatility, quiet market phase.
During these periods, market momentum is balanced — neither buyers nor sellers are dominant — and smart money is quietly positioning for the next move.
The color of the oscillator during these flat phases provides crucial insight into who is gaining control beneath the surface:
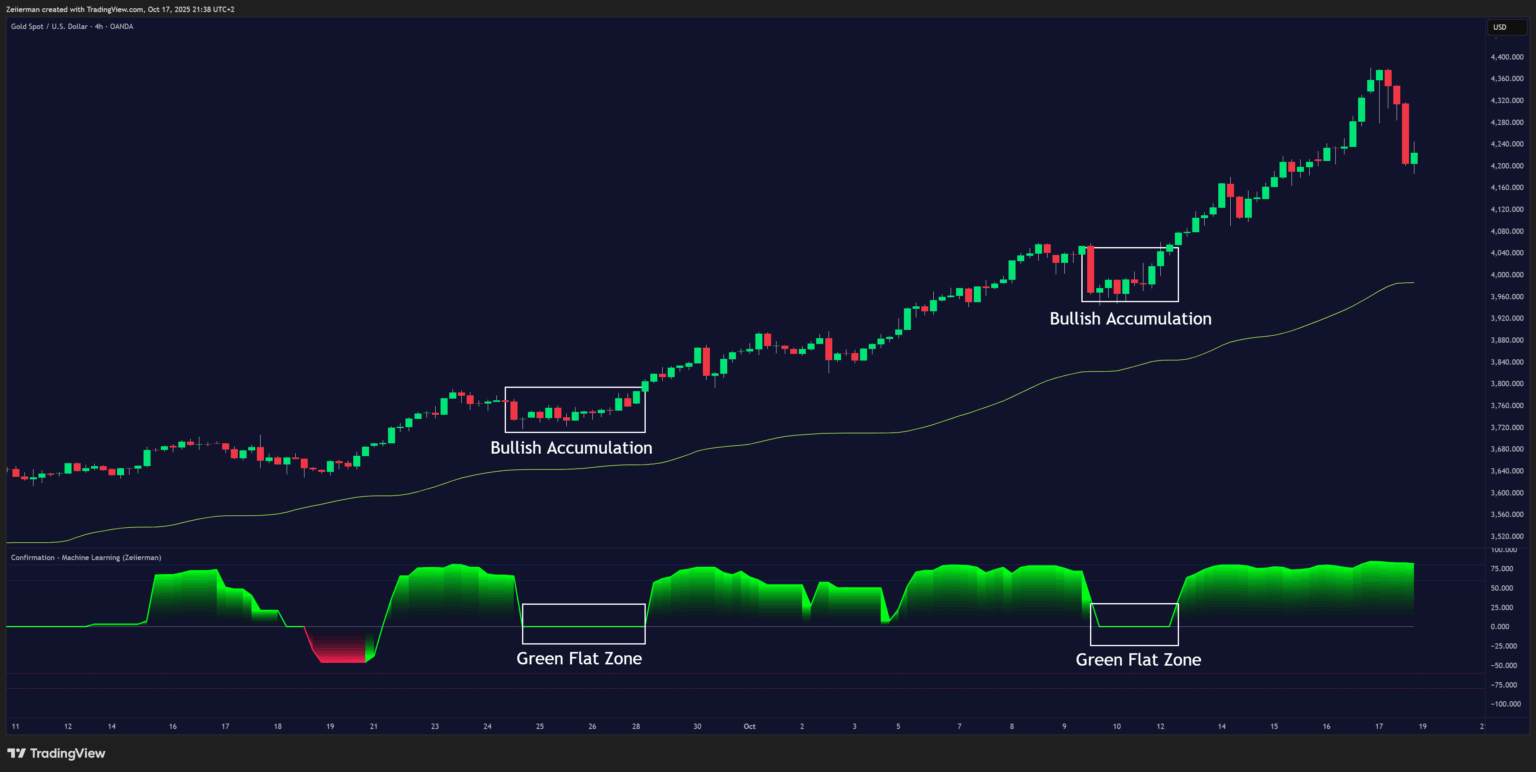
Green Flat Zone → Bullish Accumulation (Buy-Side Accumulation)
When the oscillator is flat near zero but remains green, it shows that buyers hold subtle control while the market trades sideways. This indicates accumulation, where larger players are gradually building long positions within a tight price range after a decline or during an early uptrend.
This phase often precedes a bullish breakout once enough liquidity builds and demand outweighs supply.
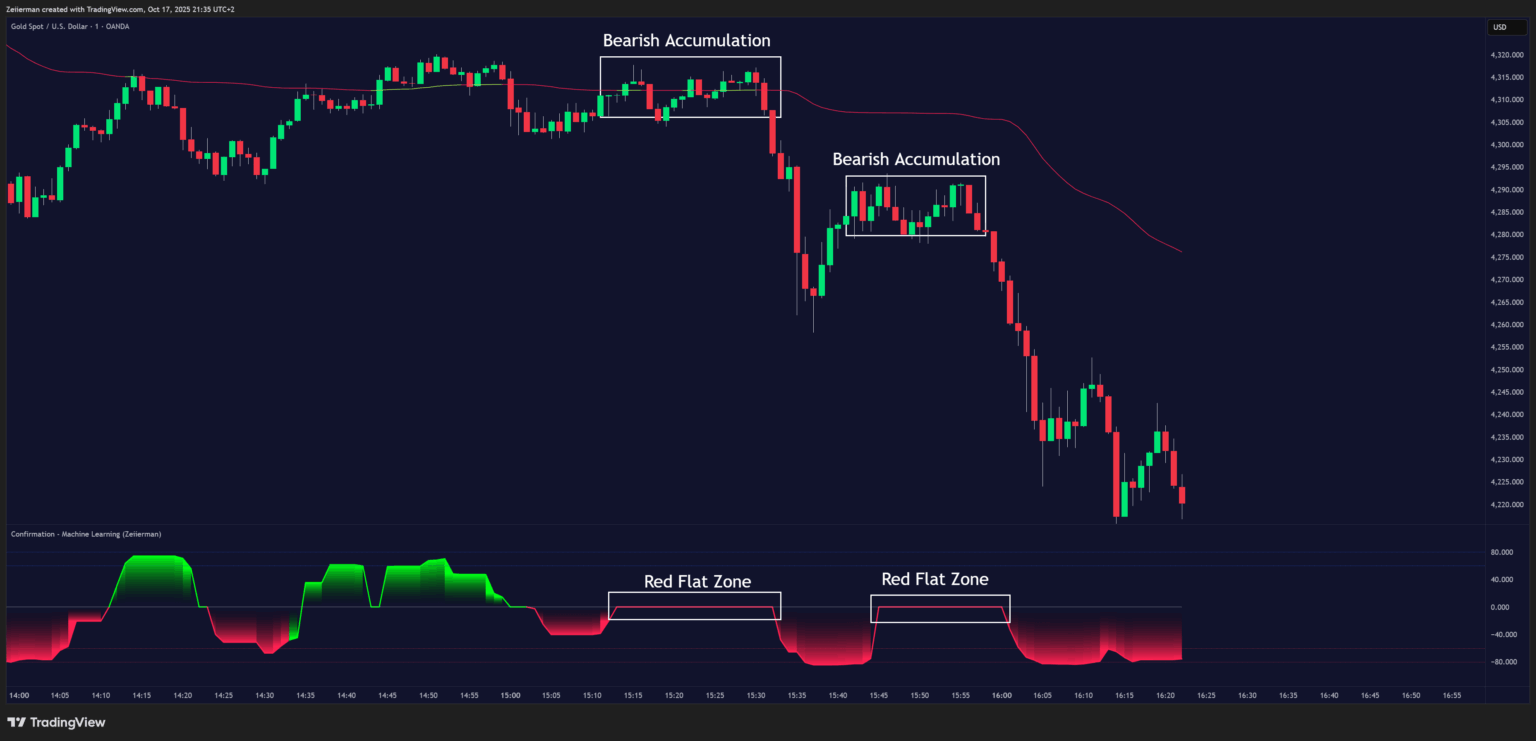
Red Flat Zone → Bearish Accumulation / Distribution (Sell-Side Rebuild Phase)
When the oscillator is flat near zero and remains red, sellers are quietly maintaining control. This represents a bearish resting phase — large players may be building or reloading short positions during a pullback or mild recovery inside a broader downtrend.
These zones act as “bearish accumulations” rather than classic tops — they often appear before the next wave of downside momentum resumes.
Simple Strategy: Confirmation – Machine Learning (Zeiierman)
Goal: This strategy helps traders enter and manage trades in alignment with the prevailing trend by combining the Dynamic Confirmation Trend Line with momentum impulses detected by the Confirmation Oscillator. The goal is to catch pullbacks and rejoin the main trend with precise timing.
Settings: Use the default settings of the indicator for balanced behavior.
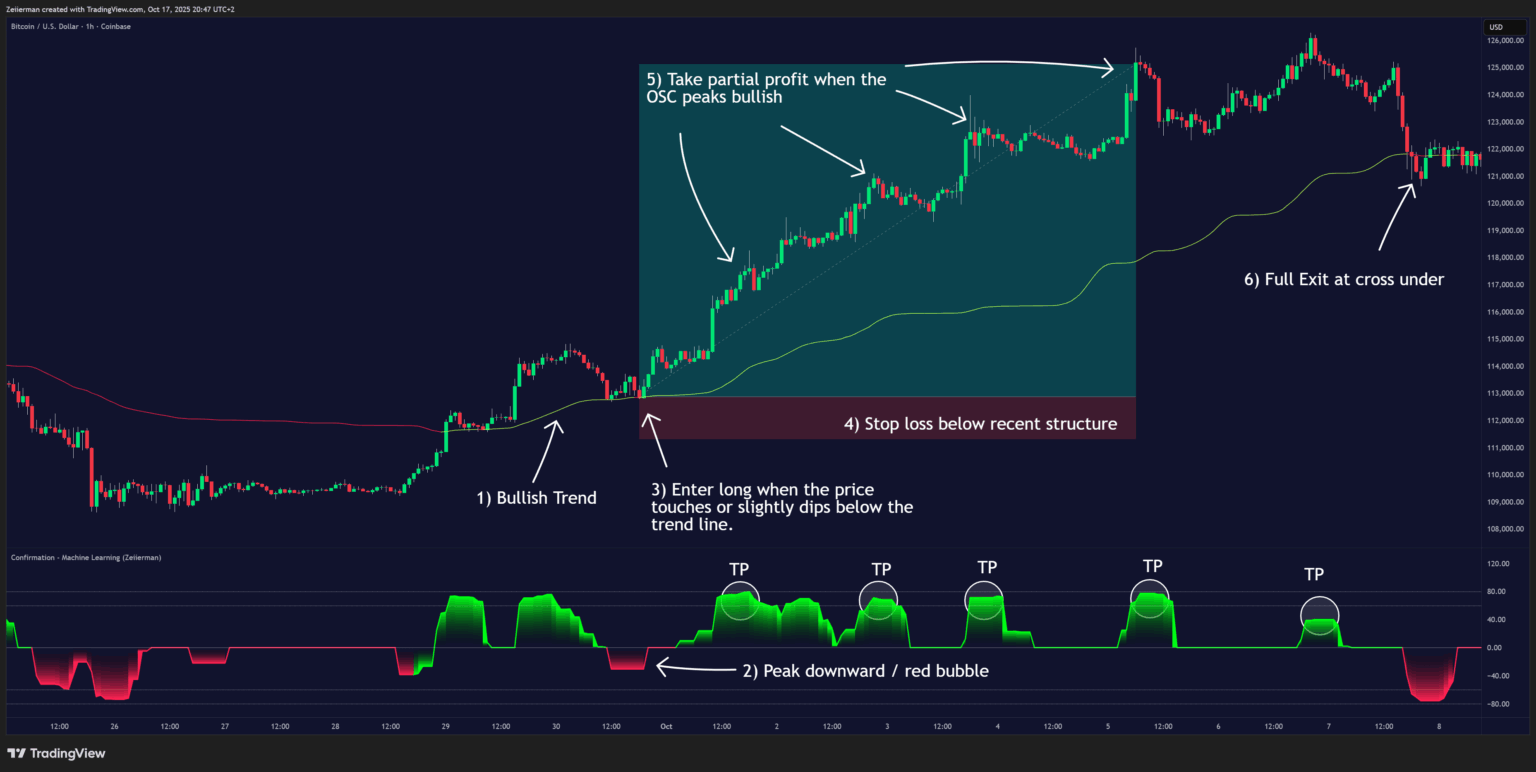
A. Long Setup (Bullish Scenario)
Step 1: Determine Trend Direction
Use the Dynamic Confirmation Trend Line (overlayed on the price chart) to define the dominant trend.
- The trend is bullish when the line is green.
Step 2: Identify Counter Impulse
During a bullish trend, wait for a temporary bearish pullback.
- Look for the Confirmation Oscillator to peak downward or form a red bubble below zero.
- This shows short-term weakness inside the broader uptrend.
Step 3: Confirm Trigger
When the oscillator peaks downward (showing a bearish impulse) while the Dynamic Confirmation Trend Line remains green, it indicates a bullish continuation opportunity.
Step 4: Entry
Enter a long position as close to the Dynamic Confirmation Trend Line as possible.
- The best setups occur when the price touches or slightly dips below the trend line and then starts turning back up.
Step 5: Stop Loss
Place the stop loss below the nearest swing low or a few ticks below the trend line for protection.
Step 6: Take Profit
- Take partial profit when the Confirmation Oscillator shows a new bullish impulse (green rise).
- Continue scaling out on subsequent bullish impulses as momentum extends upward.
Step 7: Full Exit
Close the position completely when either:
- Price closes below the Dynamic Confirmation Trend Line, or
- The Confirmation Oscillator turns red (showing momentum shift).
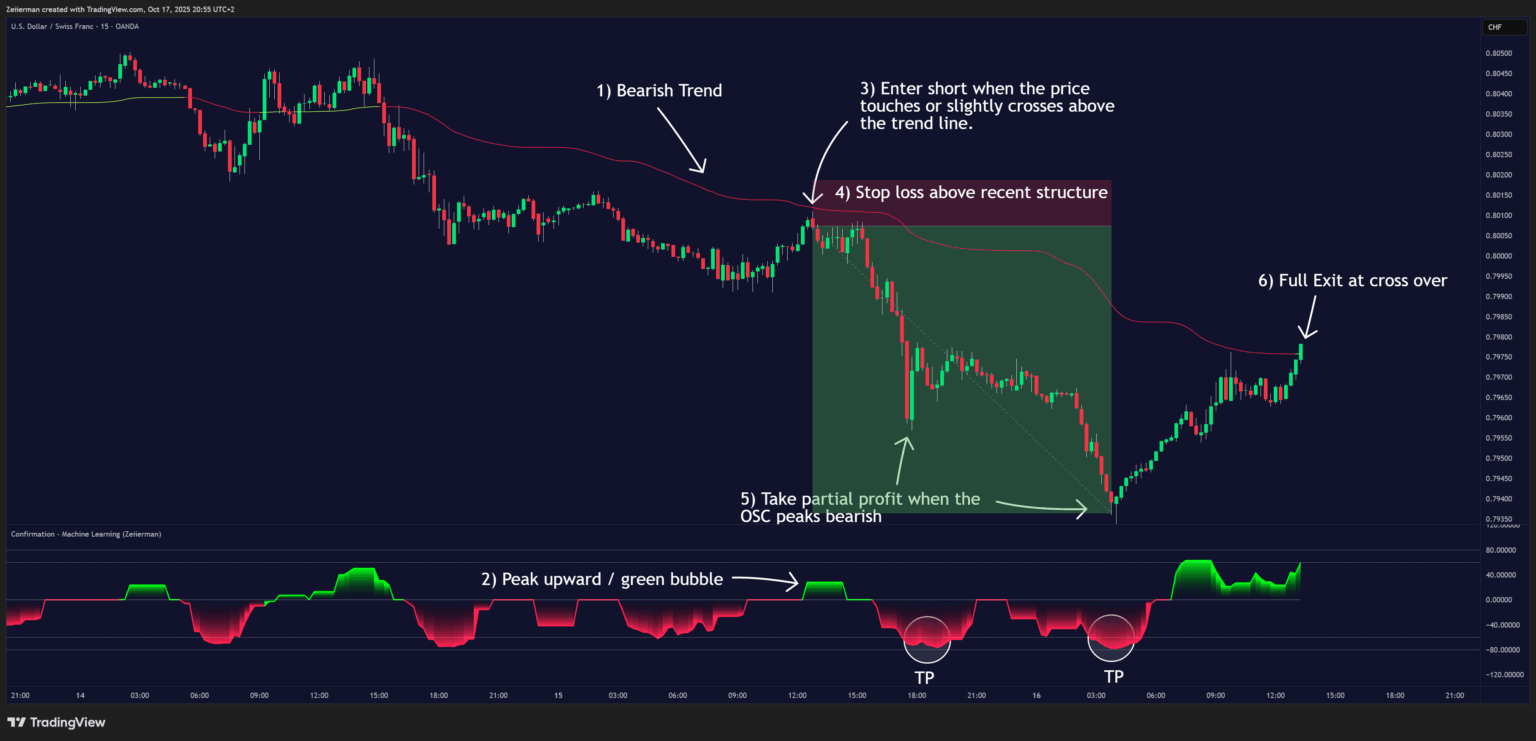
B. Short Setup (Bearish Scenario)
Step 1: Determine Trend Direction
Use the Dynamic Confirmation Trend Line to identify the main trend.
- The trend is bearish when the line is red.
Step 2: Identify Counter Impulse
During a bearish trend, wait for a temporary bullish pullback.
- Look for the Confirmation Oscillator to peak upward or form a green bubble above zero.
- This shows short-term strength within the broader downtrend.
Step 3: Confirm Trigger
When the oscillator peaks upward (showing a bullish impulse) while the Dynamic Confirmation Trend Line remains red, it signals a bearish continuation setup.
Step 4: Entry
Enter a short position as close to the Dynamic Confirmation Trend Line as possible.
- Ideally, price touches or slightly crosses above the trend line and then begins to roll over.
Step 5: Stop Loss
Place the stop loss above the nearest swing high or slightly above the trend line.
Step 6: Take Profit
- Take partial profit when the Confirmation Oscillator shows a bearish impulse (red drop).
- Continue scaling out on each new bearish impulse as momentum strengthens.
Step 7: Full Exit
Close the short position completely when either:
- Price closes above the Dynamic Confirmation Trend Line, or
- The Confirmation Oscillator turns green (indicating a potential reversal).
Settings Explained
Trend Period
Controls how far back the trend condition is analyzed.
- Shorter values: More sensitive, faster reactions.
- Longer values: Smoother, more reliable but slower responses.
Trend Move Period
Sets the lookback for the volatility-based dynamic trend detection.
Lower values react quickly; higher values focus on broader trend shifts.
Price Action Aware
When enabled, recent price behavior is factored in for faster reaction to volatility. When off, the indicator behaves more like a stable long-term filter.
Oscillator Display
- Osc: Toggle visibility of the oscillator.
- Column (LightMode): Display the oscillator as bars instead of a line.
Price Trend
Shows the early trend signal derived from the oscillator’s smoothed momentum.
Trend Line
Displays the dynamic confirmation line directly on the chart to show directional bias.
Color Inputs
Customize bullish and bearish colors for oscillator, early trend, and dynamic trend line for better visual clarity.
Quick Tuning Tips
1) Scalping / Fast Markets
If you trade short timeframes or volatile pairs and want quick signals:
- Price Action Aware: ON
- Trend Period: Lower (e.g., 4–6) for a snappier oscillator
- Trend Move Period: Lower (e.g., 10–14) for quicker trend-line shifts
- Price Trend (early line): ON (use it to catch pullbacks early)
- Trend Line: ON (use as dynamic bias/stop guide)
- Column (LightMode): Optional ON for strong visual contrast
Result: Highly responsive readings that catch micro-swings and intraday pullbacks sooner (expect more signals and some extra noise).
2) Swing / Trend Following
If you prefer bigger moves and fewer signals:
- Price Action Aware: OFF (smoother, less reactive)
- Trend Period: Higher (e.g., 10–14+) to stabilize the oscillator
- Trend Move Period: Higher (e.g., 24–40) to reduce whipsaws in the trend line
- Price Trend (early line): Optional OFF (use for secondary confirmation only)
- Trend Line: ON (primary bias filter; price above = long bias, below = short bias)
- Column (LightMode): OFF (cleaner view)
Result: A slower, steadier configuration that filters small fluctuations and stays aligned with the dominant trend.
3) Reducing Noise / Choppy Markets
When price is range-bound or erratic:
- Price Action Aware: OFF (avoid chasing micro-moves)
- Trend Period: Increase (e.g., +2–4 from your current value)
- Trend Move Period: Increase (e.g., 28–50) to calm trend-line flips
- Price Trend (early line): Consider OFF (it’s intentionally fast)
- Column (LightMode): OFF (less visual churn)
- Tip: Favor trades when the oscillator leaves the zero band and price respects the Trend Line in the same direction; use ±60/±80 as added filters.
Result: A calmer, more selective read that avoids most false starts in chop.
Frequently Asked Questions (FAQs)
Q1: What makes this indicator different from a regular oscillator?
It blends price action, volatility, and a dynamic trend model, allowing it to adapt to fast-changing markets while still filtering noise.
Q2: Can I use it on any timeframe or asset?
Yes. It works across all markets and timeframes, though shorter timeframes may show more fluctuations.
Q3: How do I use the Trend Line on price?
When price is above the line, look for buy opportunities; when below, look for sells. It dynamically shifts with the market.
Q4: Is this a buy/sell signal indicator?
No — it’s a confirmation tool. It helps you validate your own trade setups by showing when market momentum aligns with your bias.
Q5: How do I interpret Accumulation and Distribution Zones?
When the oscillator stays flat near zero, the market is in a quiet or neutral phase — a potential accumulation or distribution zone.
- Flat and Green: Buyers quietly control the market — bullish accumulation or reloading long positions.
- Flat and Red: Sellers quietly control the market — bearish accumulation/distribution or short reloading. These phases often appear before large impulsive moves as volatility returns.
Q6: Can Accumulation or Distribution occur inside a trend?
Yes. These zones don’t always appear at the start or end of a trend — they can occur within a larger trend.
For example:
- In an uptrend, a flat green oscillator can represent a bullish pullback base (accumulation before continuation).
- In a downtrend, a flat red oscillator may indicate a bearish rest or reload phase (distribution before the next drop).
Q7: How do I spot early reversals with this indicator?
Enable the “Price Trend” setting to activate the Early Price Trend Line.
When it changes color or crosses zero, it provides a faster signal of potential reversal before the main oscillator confirms.
This is particularly useful for anticipating turnarounds at exhaustion points or the end of pullbacks.
Q8: What does it mean when the oscillator changes color but stays near zero?
That represents indecision or liquidity building. The market is balanced, with both buyers and sellers active. Once the oscillator color holds steadily in one direction and breaks away from zero, it typically marks the start of a new directional move.
Q9: Why does the oscillator sometimes stay flat for a long time?
That’s typical during low-volatility consolidation or liquidity build-up phases.
When it stays flat but colored, it means one side (bullish or bearish) is quietly accumulating control — watch for the next breakout in that direction.
Q10: How should I read the oscillator levels (+80 / –80)?
Those levels represent extreme momentum zones:
- Above +80 → Overbought or strong bullish pressure (watch for exhaustion).
- Below –80 → Oversold or strong bearish pressure (watch for rebounds).
Values returning from these extremes often signal the beginning of a new impulse or correction.
Q11: What’s the difference between the main oscillator and the Early Price Trend Line?
- The Confirmation Oscillator tracks overall momentum and directional bias.
- The Early Price Trend Line (when enabled) reacts faster and highlights short-term changes within that broader momentum.
Q12: What’s the best setting for scalping or swing trading?
- For scalping: enable Price Action Aware, use shorter periods (e.g., 40–60).
- For swing trading: disable Price Action Aware, use longer periods (80–120).
Q13: Does the indicator repaint?
No. All components of the indicator — including the Dynamic Confirmation Trend Line, Oscillator, and Early Price Trend — are calculated using completed bars only, ensuring stable and reliable readings.
Zeiierman
With over 16 years in the market, Zeiierman has extensive experience as a full-time trader and risk advisory consultant for hedge funds. He has developed many profitable trading strategies, drawing on his background in risk management and strategy execution.
More from Zeiierman

![Trend Analysis [Ultimate]](https://www.zeiierman.com/wp-content/uploads/2025/03/Trend-Analysis-Ultimate-Update-300x151.png)