Works on the Following Platforms
TradingView
For use on the TradingView platform
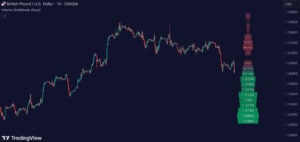
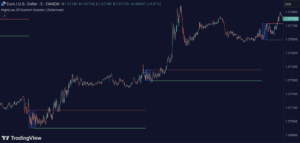
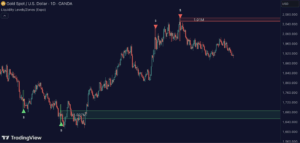
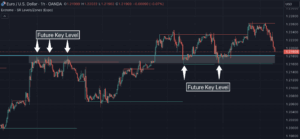
The “Average High Traded Volume (Nodes) – Levels/Zones (Expo)” indicator, also referred to as “Volume Nodes (Expo),” is designed for the TradingView platform to identify significant trading zones based on volume aggregation. This indicator helps traders to spot areas where substantial trading activity has taken place, which can serve as potential support or resistance levels.
How the Volume Nodes Works
This indicator calculates aggregated volume data over specified periods to highlight areas where trading activity has been particularly high. It uses a combination of short-term and long-term aggregation to provide insights for different trading strategies.
Key Components of the Volume Nodes Include:
- Short-Term and Long-Term Nodes: Separate settings for identifying volume nodes over different time horizons allow traders to adapt to both quick scalps and longer-term trades.
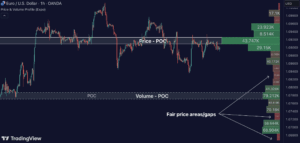
- Changeable Colors: The indicator colors the volume nodes differently based on whether the current price is above or below these nodes, enhancing visual cues for trading decisions.
- Confirmation Delays: A configurable delay in recognizing volume nodes helps confirm their relevance before they are displayed, reducing potential false signals.
Usage of the Volume Nodes
Traders can use the Volume Nodes (Expo) to:
- Identify key price levels where significant volume has been traded, which might act as support or resistance.
- Determine entry and exit points based on the proximity of the price to these volume-aggregated levels.
- Enhance other trading strategies by providing a volume-based context to price movements.
Features of the Volume Nodes
- Volume Aggregation Period: Allows setting the period over which volume is aggregated, thus defining the robustness and relevance of identified nodes.
- Smoothness Adjustment: Traders can adjust the smoothness of the aggregated volume curve, which helps in smoothing out noise and focusing on significant levels.
- Color Dynamics: The nodes change colors based on the price’s position relative to these levels, which assists in quick decision-making.
- Support for Multiple Time Frames: Adaptable to various trading time frames, from intraday to long-term investment horizons.
Conclusion
The “Average High Traded Volume (Nodes) – Levels/Zones (Expo)” indicator is a valuable tool for traders who focus on volume analysis to guide their trading decisions. By highlighting areas of significant traded volume, it offers a data-driven basis for identifying potential turning points and areas of price consolidation. Whether used standalone or in conjunction with other indicators, it provides a deeper insight into market dynamics and helps in crafting more informed trading strategies.
Zeiierman
With over 16 years in the market, Zeiierman has extensive experience as a full-time trader and risk advisory consultant for hedge funds. He has developed many profitable trading strategies, drawing on his background in risk management and strategy execution.
More from Zeiierman