Cluttered charts can kill your focus. Technical analysis often goes out the window when your TradingView chart becomes a digital mess of overlapping indicator values and labels.
A clean chart isn’t just about making things look pretty; it’s absolutely crucial for clear analysis, sharper decision-making, and ultimately, a more confident trading style. I know, I know. This sounds too hoity-toity for just chart settings, but trust me, it’s necessary.
Let’s declutter your workspace. One step at a time.
How to hide (or disable) indicator labels on TradingView charts?
Indicator labels are the text you see on the right-hand price scale. For example, if you have the RSI enabled, you might see something like RSI: 54.27 floating next to your candles. Over time, especially with multiple indicators, these components pile up and cover the scale. Here’s how to remove them:
Step 1:
Log in to your TradingView account and go to a chart layout.
Step 2:
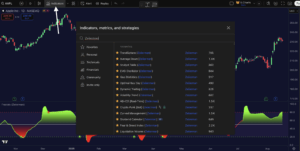
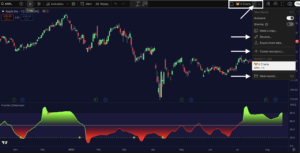
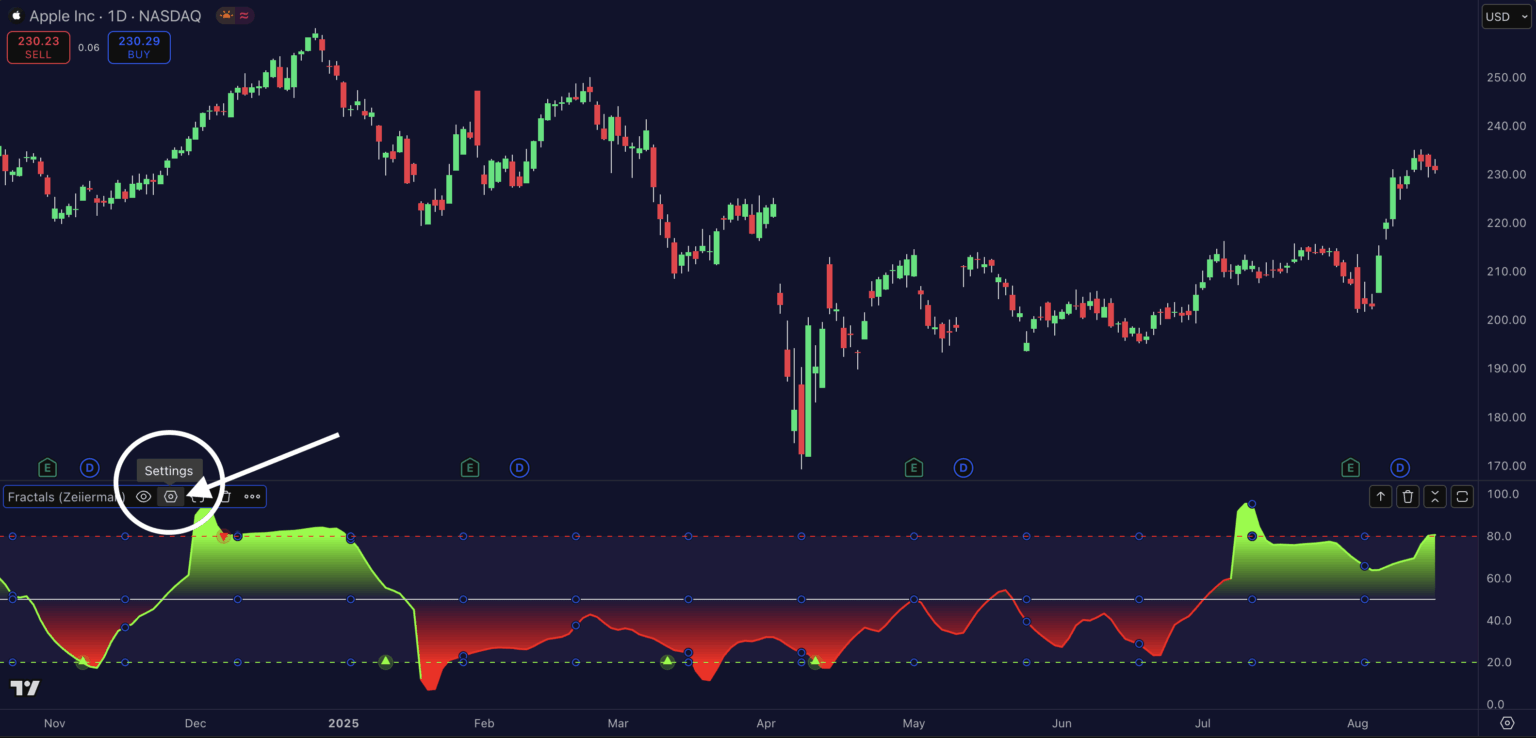
To open indicator settings, double-click directly on the indicator’s line or plot on your chart. Another way is to click on the settings option (the gear icon) located in the top right corner of the chart.
Step 3:
In the settings menu, navigate to the “Style” tab. Scroll down to see the “Output Values” section in the menu.
Step 4:
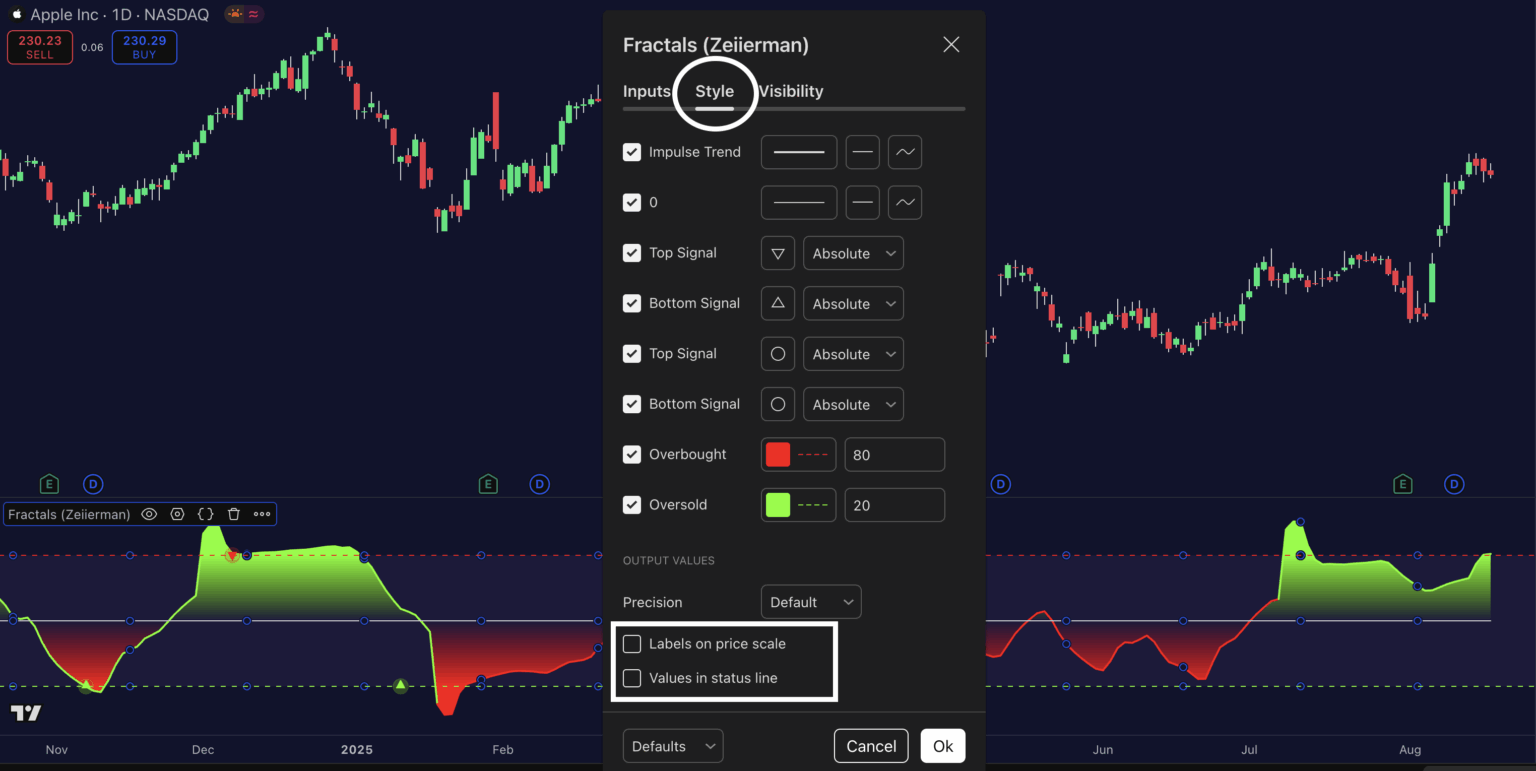
Look for the options, “Labels on price scale” and “Values in status line.” Uncheck these options to hide the indicator labels on your chart.
Read: How to Mark Take Profit and Stop Loss on TradingView (Step-by-Step Guide)How to hide (or disable) values and inputs on TradingView charts?
Inputs are the parameter settings displayed with your indicators, like the “(14)” in “RSI (14)” or “(12,26,9)” in MACD (12,26,9). Values, on the other hand, are the actual numbers that indicators display, like “45.67” next to your moving average indicator name. Here’s how to remove them:
Step 1:
Log in to your TradingView account and go to a chart layout.
Step 2:
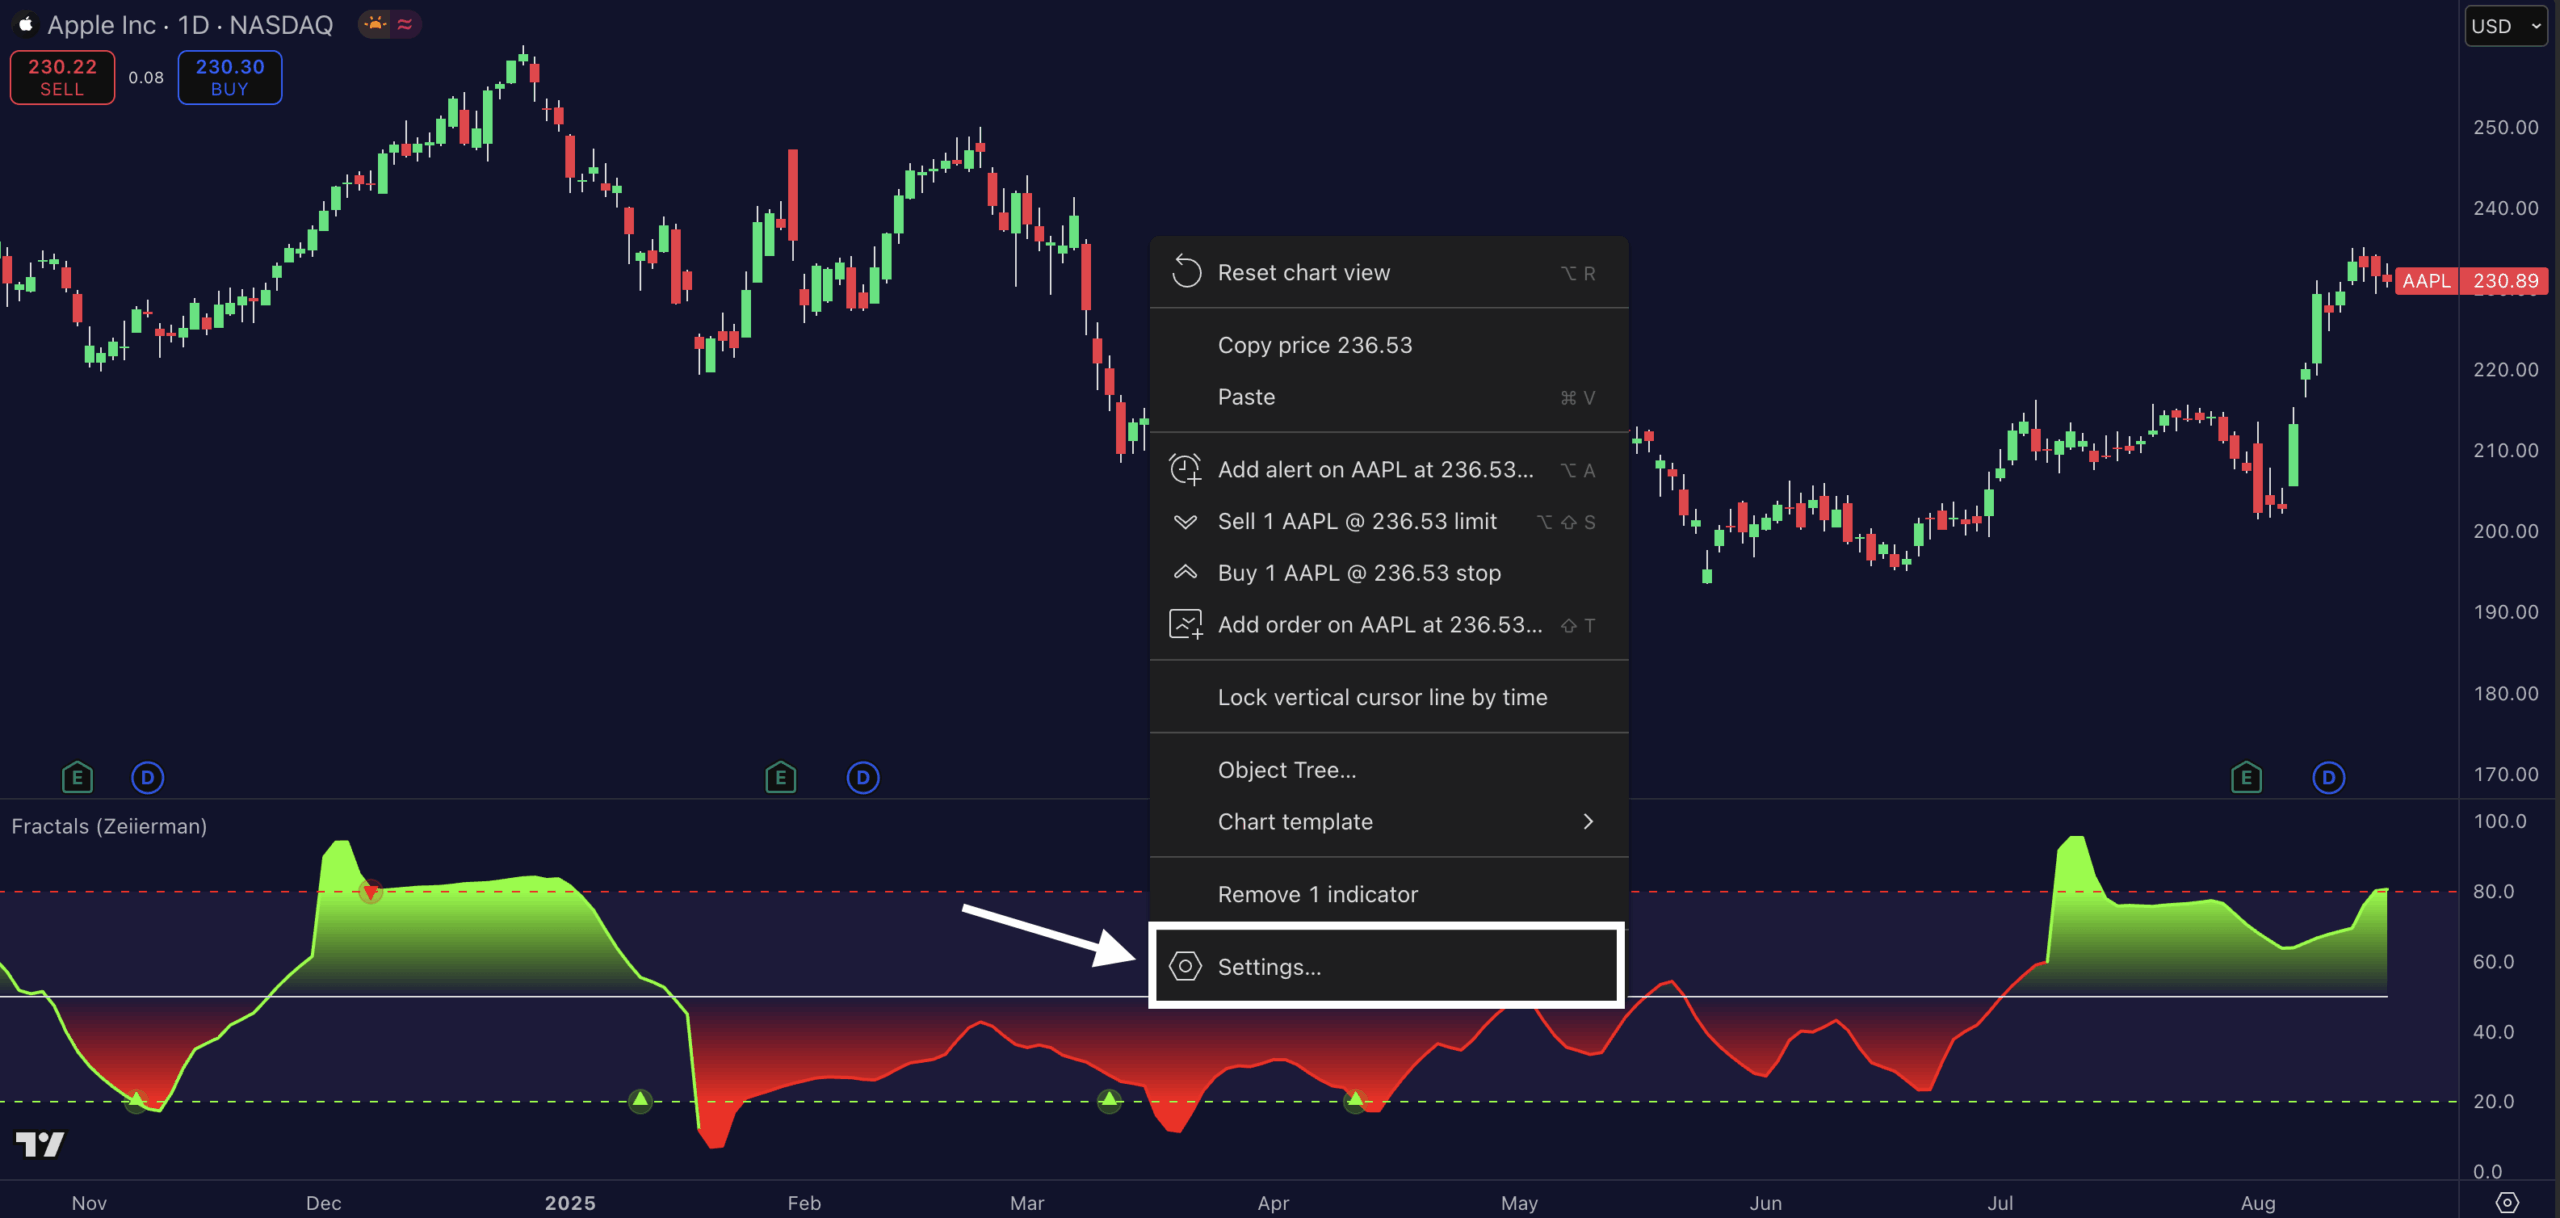
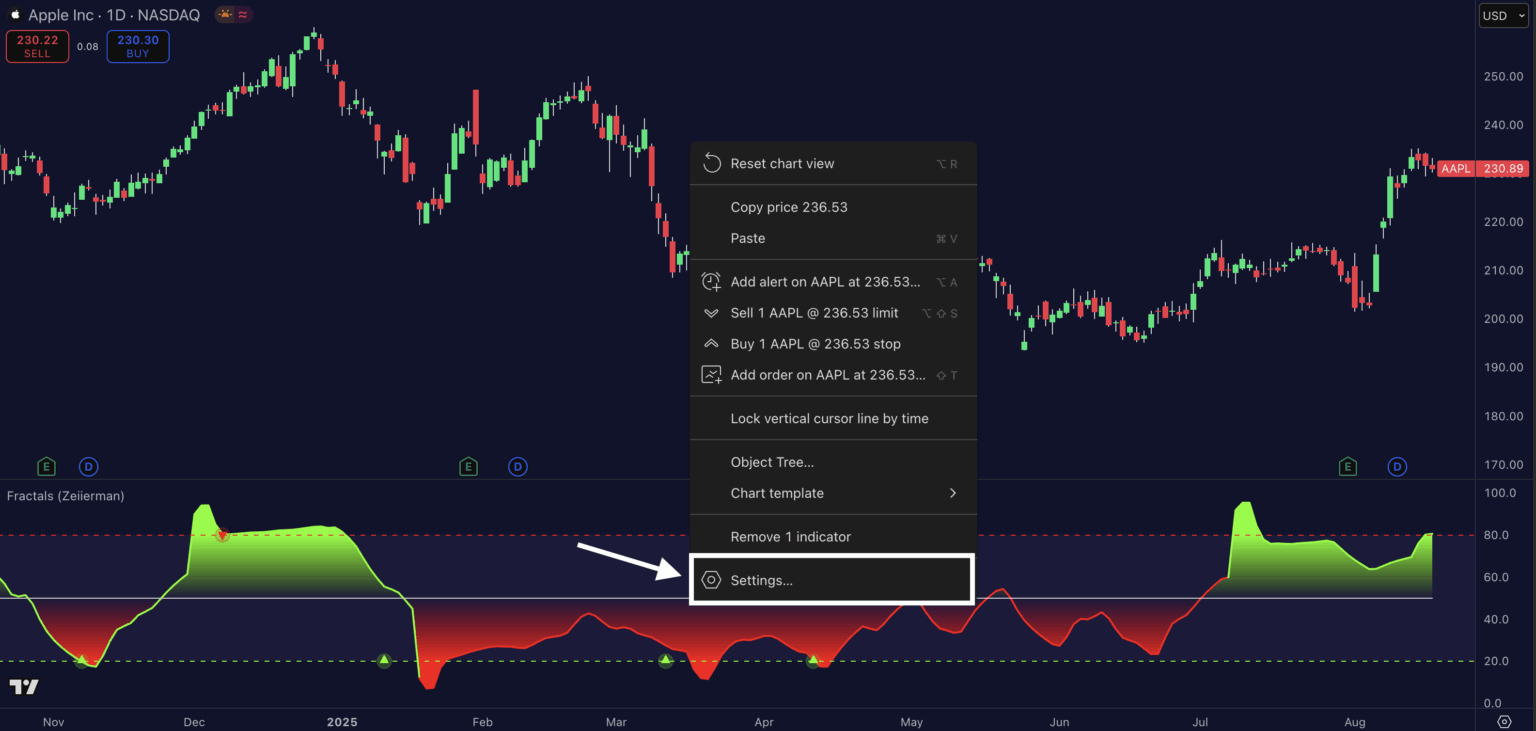
Right click on the chart and go to settings.
Step 3:
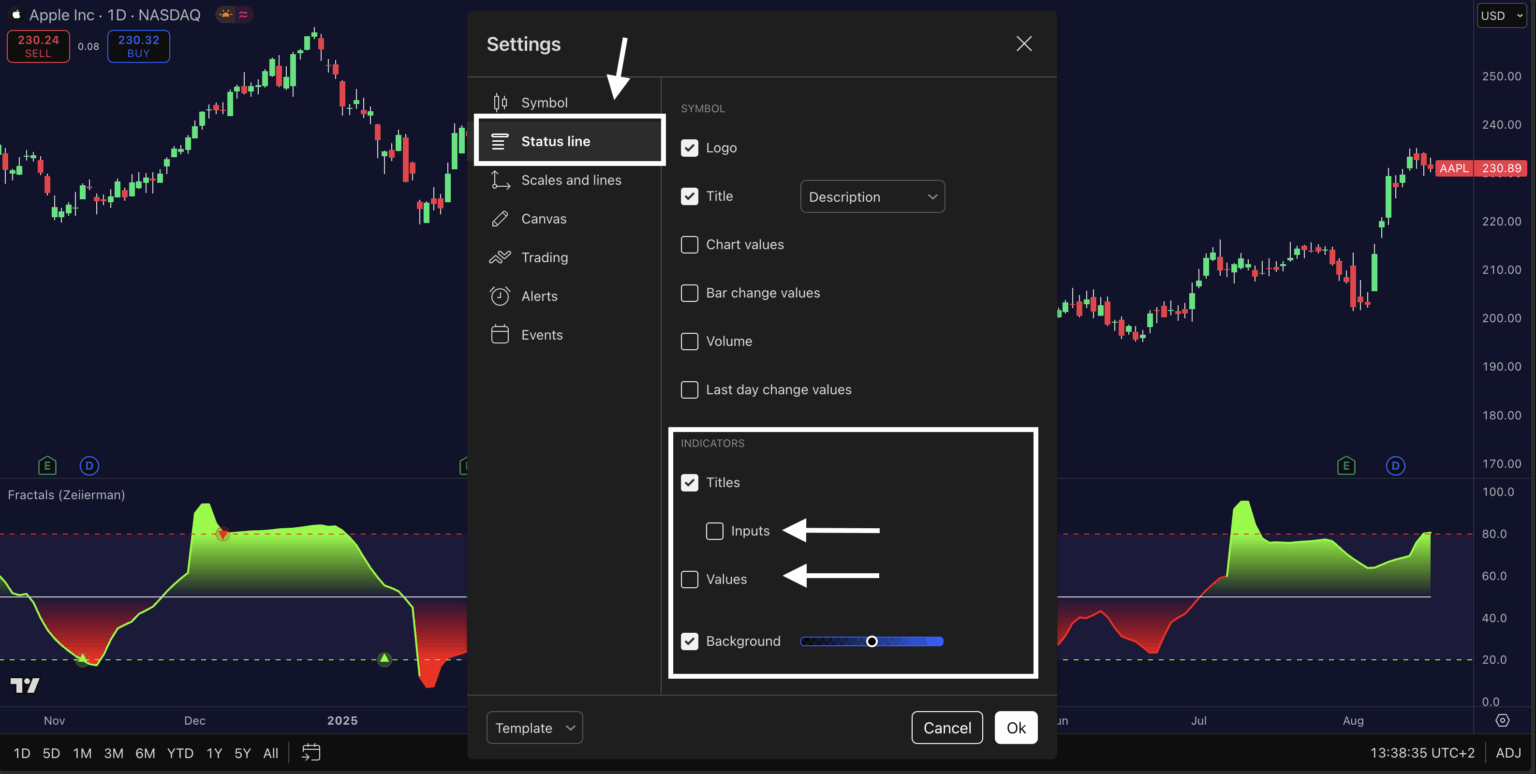
Go to Status line and scroll down to “Indicicators” now you can disable Indicators inputs and indicators values.
Step 4:
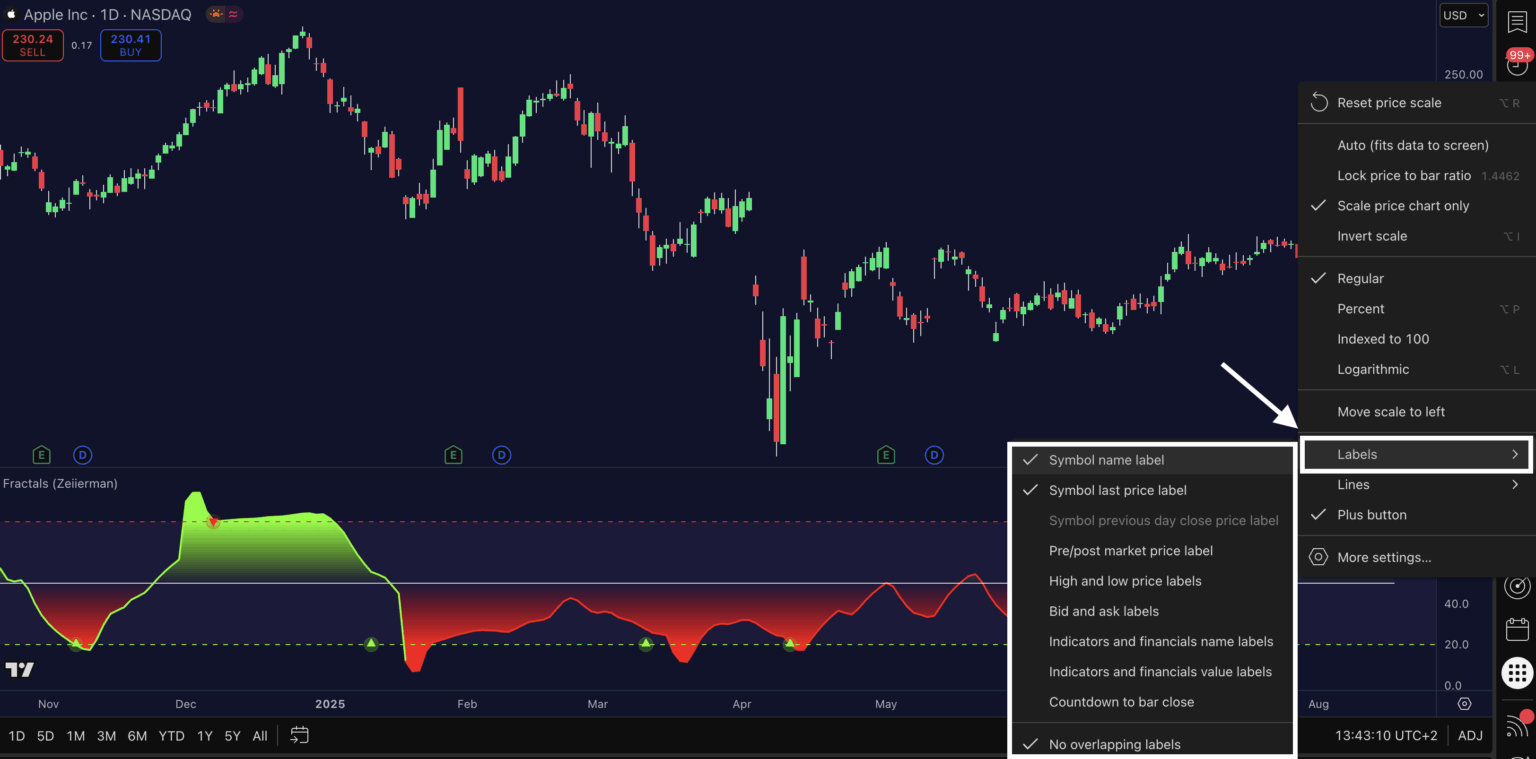
To clean up your chart even further, right click on the price scale on the right-hand side. Go to labels, and unselect the labels you don’t need on your chart.
Zeiierman
With over 16 years in the market, Zeiierman has extensive experience as a full-time trader and risk advisory consultant for hedge funds. He has developed many profitable trading strategies, drawing on his background in risk management and strategy execution.
More from Zeiierman