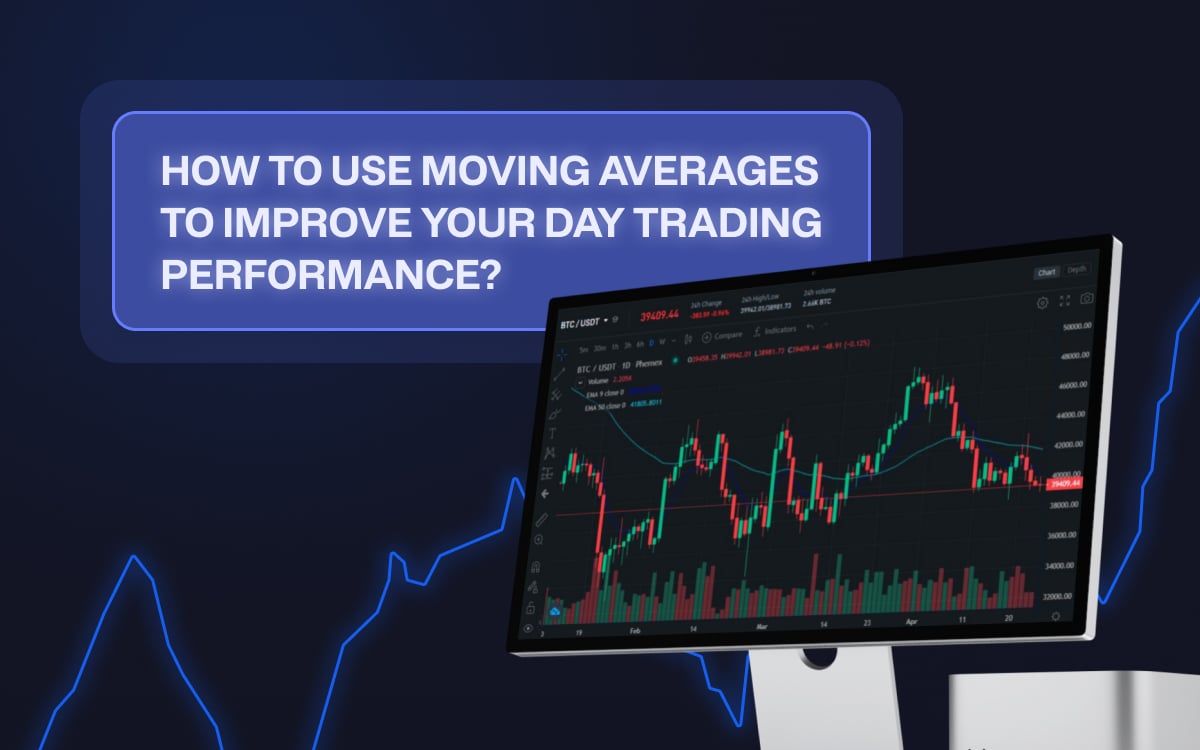
Day trading is incredibly fast. You don’t have time to debate over every candle or second-guess what the market might do. Instead, you’ll need simple tools to help read the zone, act with confidence, and manage risk like a pro. Moving averages (MAs) do precisely that. MAs can help you smooth out noise, reveal trend direction, and give you rules for entries, exits, and stops without turning your chart into a mess.
In this guide, I’ll talk about what moving averages are, which MAs actually matter for intraday trading, and how to turn them into clear strategies you can use right away with Zeiierman indicators.
What are Moving Averages? – A Quick Introduction
A moving average is simply the average price of an asset over a set number of periods, updated with each new bar, as shown by the lines that move along with the price. This averaging of prices over time helps smooth out short-term volatility so that you can see the bigger picture of the market, including its general direction, momentum, and key pullback zones.
There are common types of moving averages:
1. Simple Moving Average (SMA): This is the most straightforward kind of moving average. The SMA takes the closing prices of an asset over a certain number of periods (like 9, 20, or 50 days) and divides them by that number. It’s simple and easy to understand, and gives equal weight to every single price point in its calculation. The downside here is that it can be a little slow to react to new information.
2. Exponential Moving Average (EMA): The EMA is like the SMA’s smarter, faster version. It is calculated in a way that gives more weight to the most recent price data. For day traders, this can be very helpful because an EMA reacts much quicker to changes in the market, which is exactly what you need when you’re making quick decisions. This responsiveness is why the EMA is the go-to choice for most day traders.
📌 Export Note: Moving averages are reactive (lagging). They don’t predict the future, they confirm what’s already happening. You use them to time your move with the trend and to structure risk, not to guess tops and bottoms.
How Moving Averages Affect Day Trading?
Moving averages (MAs) are among the most practical tools an intraday trader can use, as day trading is all about speed and precision. You’re making decisions in minutes, sometimes seconds, and here every edge counts.
MAs (especially SMAs for day trading) cut through the market noise and give you a clear visual reference. That said, their real power lies in helping you identify market bias quickly. One of the first questions any day trader asks when opening a chart is whether the market is to the side of buyers or sellers.
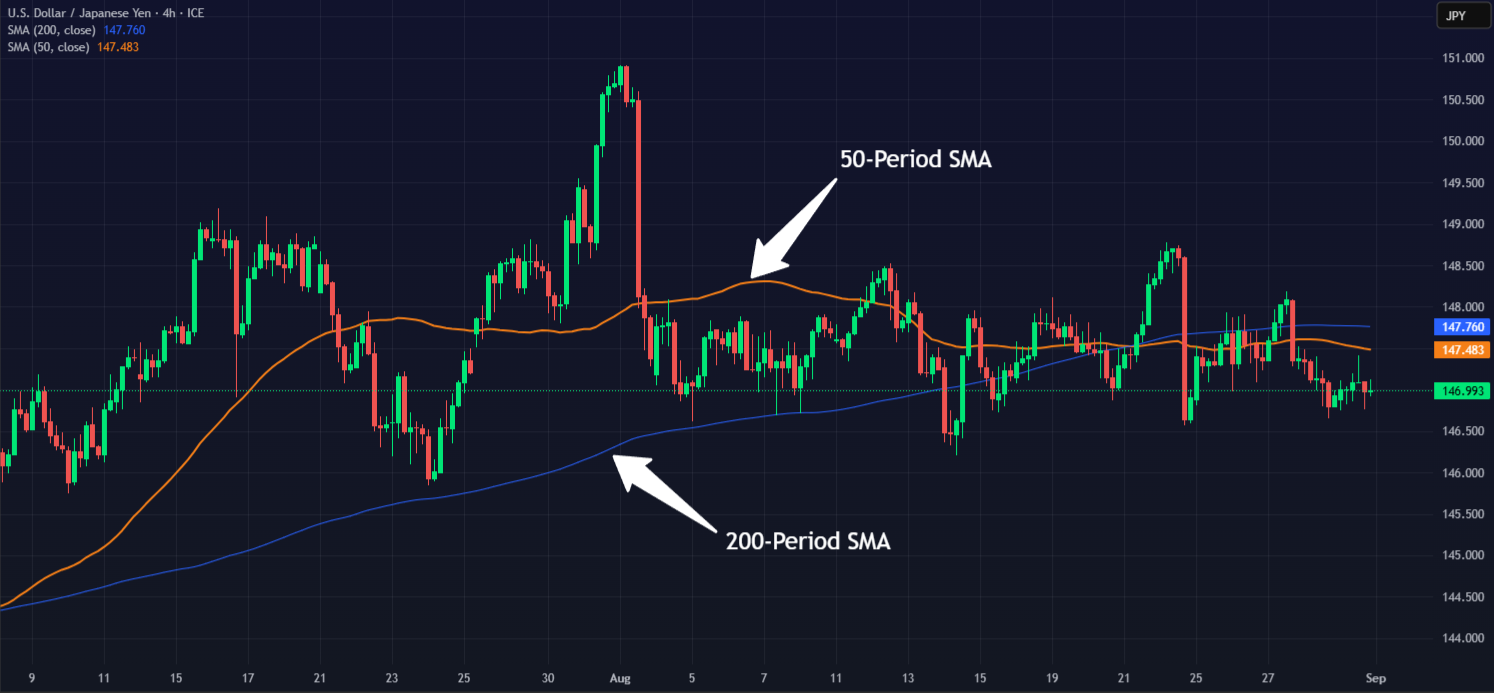
If the price is consistently holding above a key moving average, like the 20-period EMA, that’s a strong sign that buyers are in control, at least in the short term. On the other hand, if the price keeps rejecting the 50-period SMA from below, that usually is a sign of a bearish territory. Instead of guessing, you’re using a simple but effective tool to align yourself with momentum, which is crucial in day trading.
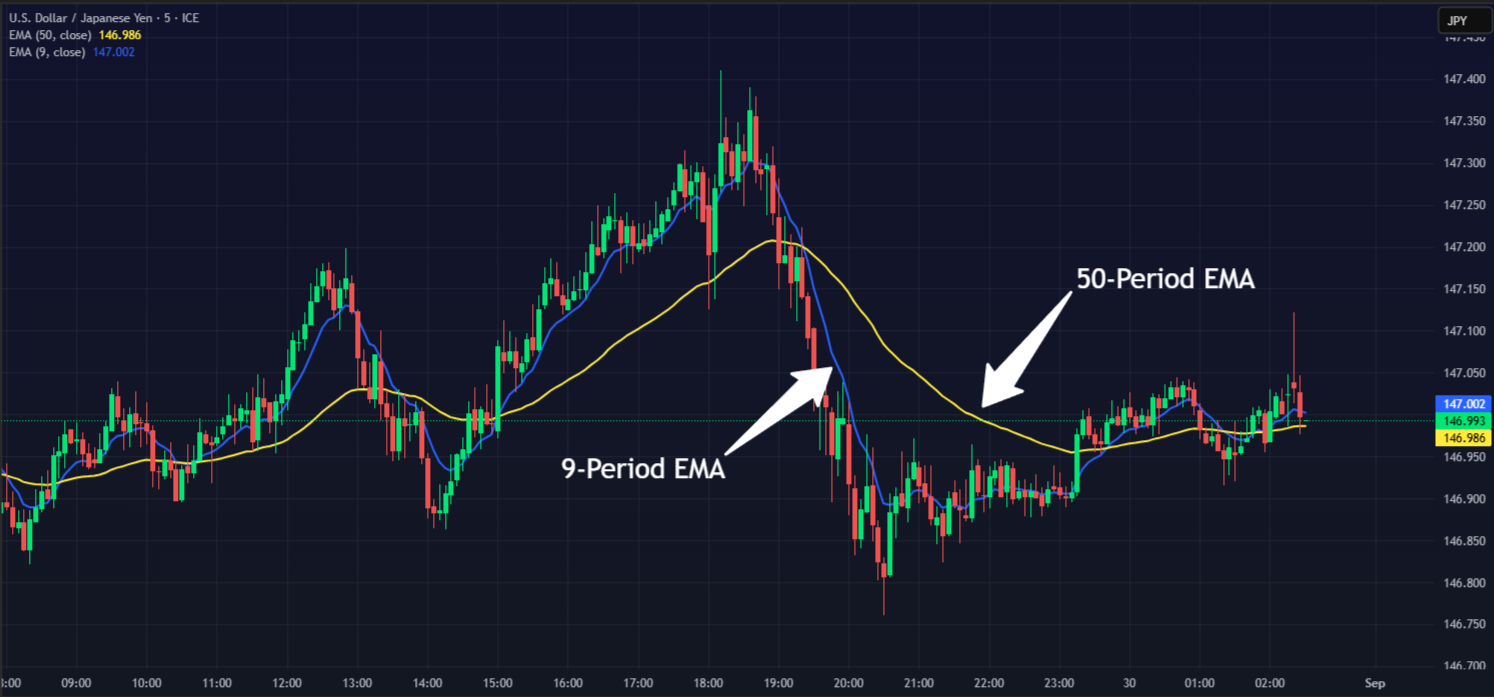
Another reason moving averages have been a classic tool for decades is the structure they bring to entries and exits. Many traders use crossover methods, such as when a 9-period EMA crosses above a 21-period EMA, as confirmation of a short-term momentum shift. Others use the moving average as a trailing stop, which means staying in the trade as long as the price respects the average and exiting once it breaks the MA line. This takes a lot of second-guessing out of the equation and helps you get a disciplined and good approach.
Additionally, the Moving Average acts as a reliable base for stacking up confluences when paired with suitable indicators. Like a simple bounce off the 20 EMA may not always be enough on its own, but if that bounce happens to coincide with a liquidity zone marked by Zeiierman’s Liquidity Levels/Zones indicator, that’s how you stack confluences in your favour.
Moving Average Strategies for Day Trading
At Zeiierman Trading, we primarily use two Moving Average (MA) strategies whenever @SM_Trader or I are day trading.
1. Double Moving Average Crossover Strategy
This is a classic strategy that uses two moving averages of different lengths, a shorter and a longer one and helps in trading based on their crossover points.
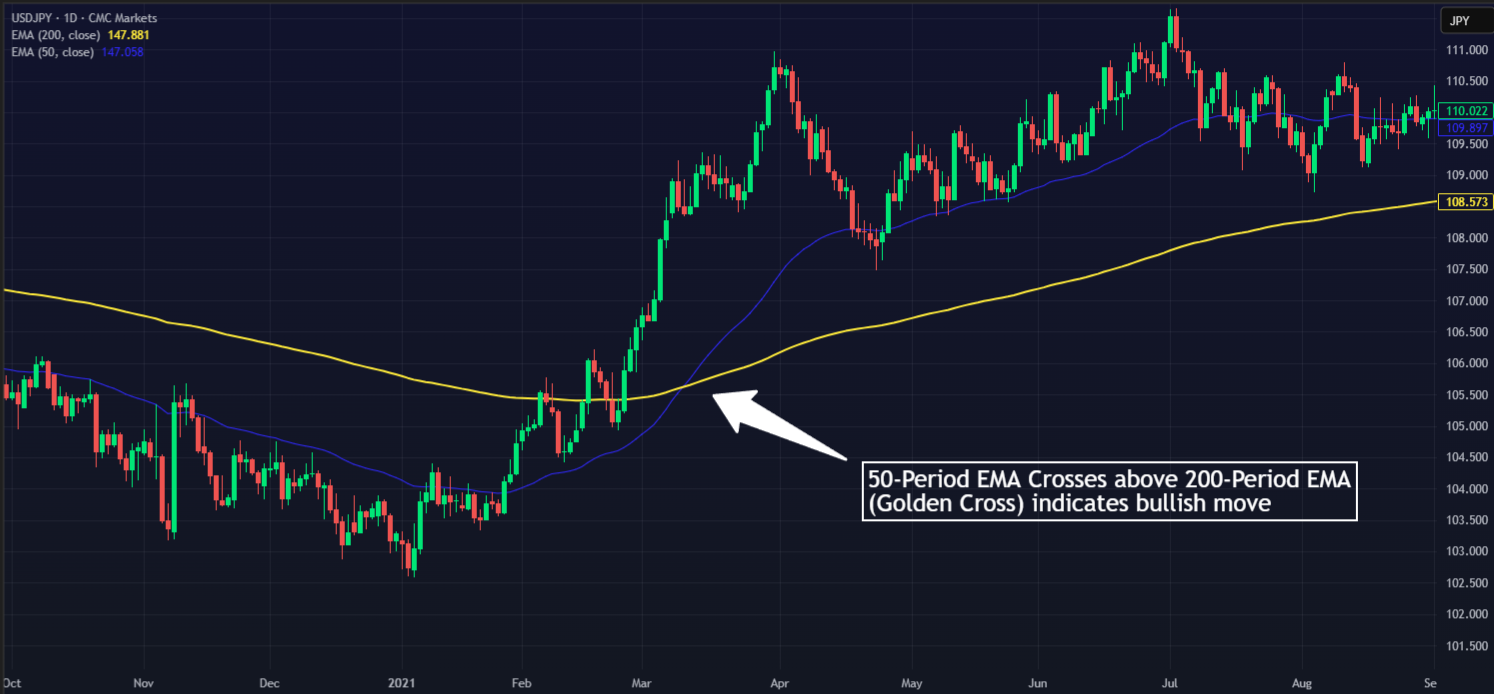
When the shorter MA crosses above the longer MA (called a Golden Cross), it’s a bullish signal. This means the shorter-term momentum is picking up faster than the long-term average, signalling a potential uptrend.
Conversely, when the shorter MA crosses below the longer MA (the Death Cross), it’s a bearish signal, warning of a downtrend. Common pairs include the 50 MA with the 200 MA for a big-picture view, or the 5 MA with the 20 MA for faster-paced day trading.
The crossover shows a shift in momentum between short-term price action and longer-term trends, helping you catch rising trends early.
📌 Pro Tip: Confirm these signals with volume surges or RSI to filter false breakouts.
2. Using EMAs as Dynamic Support and Resistance
Unlike the usual rigid and horizontal S/R lines, moving averages are dynamic since they move with the price. Here’s how the strategy works…
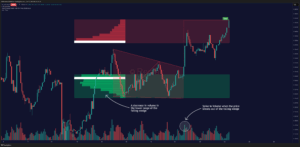
In a strong uptrend, an EMA can act like a support level, like a floor where the price keeps bouncing off. In a strong downtrend, it can be a resistance level or a ceiling that the price keeps hitting before falling again.
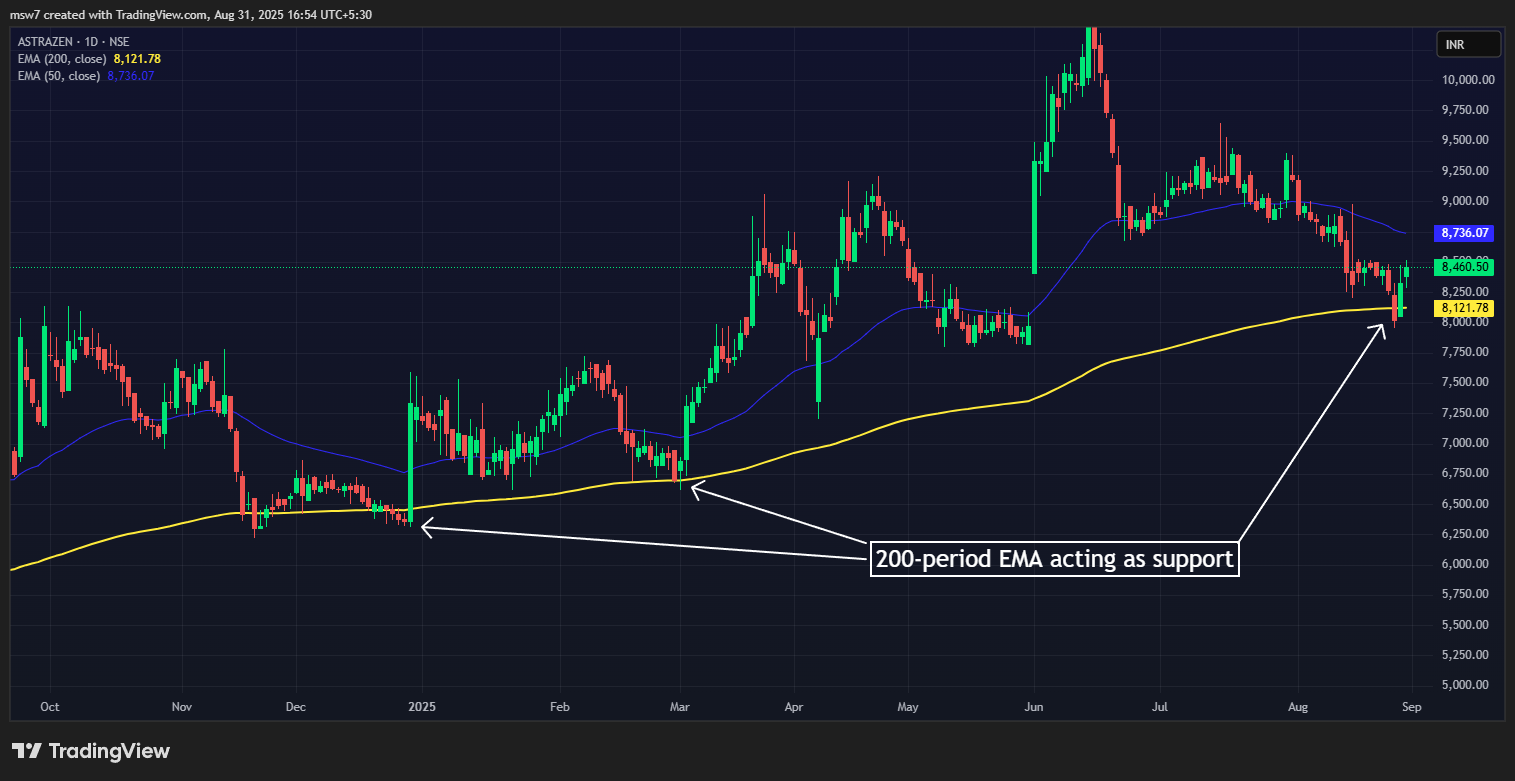
This strategy works well with trend-following. Once you’ve identified a trend, watch how the price interacts with the key EMAs. If a stock is in a clear uptrend and pulls back to its 50 or 200 EMA, and you see a bullish candlestick pattern form right on that line, that’s your cue. It shows the EMA is holding strong as support, and the trend is likely to continue.
Usually, longer-period EMAs are considered more reliable when looking for a medium to long-term trade. For example, the 200-period EMA is a reliable support for a larger price-action frame, as shown in the image below.
Making the Perfect Moving Average (MA) Setup
The real magic is in choosing the right settings for the kind of trading you’re doing. For day traders, who are in and out of positions within a single trading session, the key is to use shorter time frames with moving average periods.
1. Ideal Time Period for Day Trading
Most traders make the mistake of using too many moving averages or picking random numbers they saw in some YouTube video. Here are some proven period suggestions:
- Fast MAs (5, 9, 12 periods) are your early warning system. They react quickly to price changes and help you spot momentum shifts. Perfect for scalping and getting into trends early. The drawback here is that these often lead traders to fakeouts.
- Medium MAs (20, 21, 26 periods) are the sweet spot for most day traders. They provide good trend confirmation without too much noise. The 20 EMA is probably the most widely watched moving average in day trading.
- Slow MAs (50, 100, 200 periods) act like major support and resistance levels. They don’t give many signals, but when they do, you better pay attention. Even on intraday charts, these levels carry serious importance.
2. Popular MA Combinations That Work
- The 8/21 EMA cross is a common trading strategy that uses the crossing 8 EMA (faster) and 21 EMA (slower) to identify shifts in momentum and ride short-term trends. When the 8 crosses above the 21, you’re looking for long opportunities. When it crosses below, you can consider shorting.
- The 12/26 EMA combination is actually the foundation of MACD. It’s tried and tested by millions of traders worldwide. You can use this crossover to confirm a trend identified by other indicators. For example, if a stock is showing other bullish signs, a 12/26 EMA crossover can support a long trade.
- The 20/50/200 SMA triple system gives you the complete picture with short, medium to long term. A strong bullish signal occurs when the moving averages stack in order, with the 20-SMA on top, followed by the 50-SMA, and the 200-SMA at the bottom. Also, the golden cross with 50-SMA crossing above the 200-SMA is a powerful bullish signal and shows the start of a major upward trend.
3. Chart Time Frame Combinations
- 1-minute charts with 5 and 21 EMAs work great for scalping. You’re looking for quick moves that last 5-15 minutes. It’s widely used for quick trades.
- 5-minute charts are the bread and butter for most day traders. You can try the 8 and 21 EMA or the classic 12 and 26 setup because this time frame gives you enough information without getting lost in the noise.
- 15-minute charts work well if you prefer swing-style day trading. Use 20 or 50 EMAs for cleaner signals and bigger moves. You’ll trade less frequently but with pretty good accuracy.
Moving Average with Zeiierman Indicators
1. AI Moving Average
This is different from your traditional MAs because the AI Moving Average adapts to current market conditions using, well, artificial intelligence. Instead of just averaging past data, it learns and adjusts dynamically to volatility and momentum shifts.
Think of your standard EMA (like the 20-EMA) as your baseline trend tool. The AI Moving Average sits on top of that, adjusting in real-time. When both point in the same direction, you’ve got stronger confirmation. When they diverge, that’s your clue to slow down and consider your moves before jumping in.
Try: AI Moving Average Indicator on TradingView2. Machine Learning & Optimisation Moving Average
This version of MA doesn’t just react to price, but it actually uses machine learning algos to optimize the MA settings according to the asset and timeframe you’re trading. You can choose to find the best crossing strategy, where the algorithm compares the 2 averages and returns the best fast and slow periods.
You can use this as your base moving average line for intraday trading, and then confirm with a slower traditional MA (like the 50 EMA). When both agree, you’re trading with both math and market psychology on your side.
Try: Machine Learning & Optimization Moving Average Indicator on TradingView3. Order Blocks with MA Filters
One of the most effective ways to get better moving average signals is by using them with order blocks. Order Blocks (OB) are areas on the chart where the big players (smart money) placed large buy or sell orders in the past.
These zones often act as magnets for price because big players defend their positions, making them reliable areas of support or resistance. It can be tricky to trade only based on order block, so you can use MAs to filter out fakouts.
For example, if the indicator marks a bullish order block right near the 50 EMA, you now have two strong signals pointing in the same direction. It means the moving average confirms the broader trend, and the order block shows the institutional footprints. When the price retraces back into that order block, you can look for long opportunities with more confidence.
Try: Multitimeframe Order Block Finder Indicator on TradingViewYou can also trade in similar conditions with other indicators, like the Fair Value Gap (FVG) indicator or the Liquidity Levels/Zones.
Moving Average has been an important tool in technical analysis for many years, and its value lies in its elegant simplicity. Classic MAs still being used on millions of charts today prove how resilient and reliable they are.
SMA gave general direction, EMAs gave traders faster signals, and now, with Zeiierman Trading, we even have AI-powered moving averages that learn and adjust in real time.
Zeiierman
With over 16 years in the market, Zeiierman has extensive experience as a full-time trader and risk advisory consultant for hedge funds. He has developed many profitable trading strategies, drawing on his background in risk management and strategy execution.
More from Zeiierman